Testimony on the Distribution of the Foundation Aid Formula as it Relates to Pupil and District Needs
Submitted to the New York State Senate Joint Standing Committees on Education and on Budget and Revenues
Thank you for the opportunity to testify today. I am David Friedfel, Director of State Studies for the Citizens Budget Commission (CBC). CBC is a nonprofit, nonpartisan think tank, dedicated to achieving constructive change in the finances and services of New York City and New York State government. CBC has long advocated for all students to have access to a sound basic education (SBE) as required by the New York State Constitution. An SBE should provide students with the knowledge and skills to fulfill their potential, be productive members of society, and improve the state’s economic and civic future.
State leaders reformed state education aid in 2007, consolidating several funding streams into the “Foundation Aid” formula in order to distribute aid so the neediest districts would be equipped to meet SBE standards. However, political compromises and reluctance to decrease aid to wealthy districts resulted in flaws in the formula design. As a result—despite significant increases in state aid and local revenues—not all districts have the resources to provide an SBE, and some wealthy districts that have more than enough resources to provide an SBE receive more aid than needed.
My testimony details four key issues:
- The Foundation Aid formula is flawed. Use of old data and artificial caps limits growth in aid for some districts, while faulty calculations of local revenues and “hold harmless” provisions drive aid to other districts that is above and beyond what is needed to provide an SBE;
- Other aid streams are not based on district need;
- Total education funding has increased significantly since Foundation Aid was created; and
- In school year 2017-2018 25 districts did not have sufficient resources to provide an SBE despite statewide spending that is $13.6 billion more than needed for all districts to provide an SBE.
1. The Foundation Aid Formula is flawed.
Foundation Aid was created to ensure that all school districts have the resources to provide an SBE and now accounts for two-thirds of state education aid, or $18.4 billion of the $27.3 billion total in school year 2019-2020.
The Foundation Aid formula has four main steps:
- Determine how much it costs per student to provide an SBE in each district based on poverty, regional cost differences, and other characteristics;
- Calculate how much the local taxpayers should contribute per student;
- Determine how many students there are per district, with a heavier weight assigned to students with disabilities; and
- Set the foundation aid payable amount, subject to phase-in factors and minimum and maximum increases.
The problem is the Foundation Aid formula inequitably allocates aid by use of arbitrary adjustments, outdated data, and inconsistent local share calculations; these flaws were built into the formula from the beginning as a political compromise to assuage concerns of suburban districts.1
The formula overestimates the need for state aid to wealthy districts and results in higher than appropriate annual aid allocations. The formula does not account for what districts actually contribute, instead using a theoretical local contribution.2 The result understates many districts’ actual local funding, thereby overstating state aid needed to fund an SBE. For example, the wealthiest decile of districts spent $1.8 billion more than needed to fund an SBE in school year 2017-2018.3 These districts, which on average spent more than $31,500 per student, received $724 million in state revenues or $4,800 per pupil, and the Foundation Aid formula calculates they were due an additional $60 million in Foundation Aid.
These problems have been exacerbated by hold-harmless provisions, which prohibit decreases in school district aid allocations—even in cases of declining enrollment or increasing wealth—and an artificial limitation on aid growth regardless of increasing enrollment or need. Districts that are shortchanged cannot catch up while “overfunded” districts continue to get automatic increases.
2. Other aid streams are not based on district need.
Other aid streams that total almost $500 million would be better utilized if they were channeled into a revised Foundation Aid formula. Library, Textbook, and Software Aids total $240 million annually and do not take account of district wealth at all– providing the exact same amount of aid per student in every district. Another category of aid, High Tax Aid, specifically targets $223 million in additional State aid to wealthy districts.4
3. Total education funding has increased significantly since Foundation Aid was created.
Focusing on just changes in state aid ignores an important fiscal reality of school district funding. Districts in New York are funded through a combination of State, local, and federal resources. Between school year 2006-2007 and 2017-2018 total school district revenues increased $23 billion, or 47 percent, more than double the inflation rate during that period.5 State education aid increased 35 percent, or $7.5 billion, and local revenues increased 62 percent, or $15.4 billion, including a 119 percent increase in local revenues in New York City. The increases in state aid were larger in the least wealthy districts, while local aid increased relatively evenly outside of New York City. Federal aid growth was more variable, but it represents a comparatively small share of school district revenues. (See Table 1.)
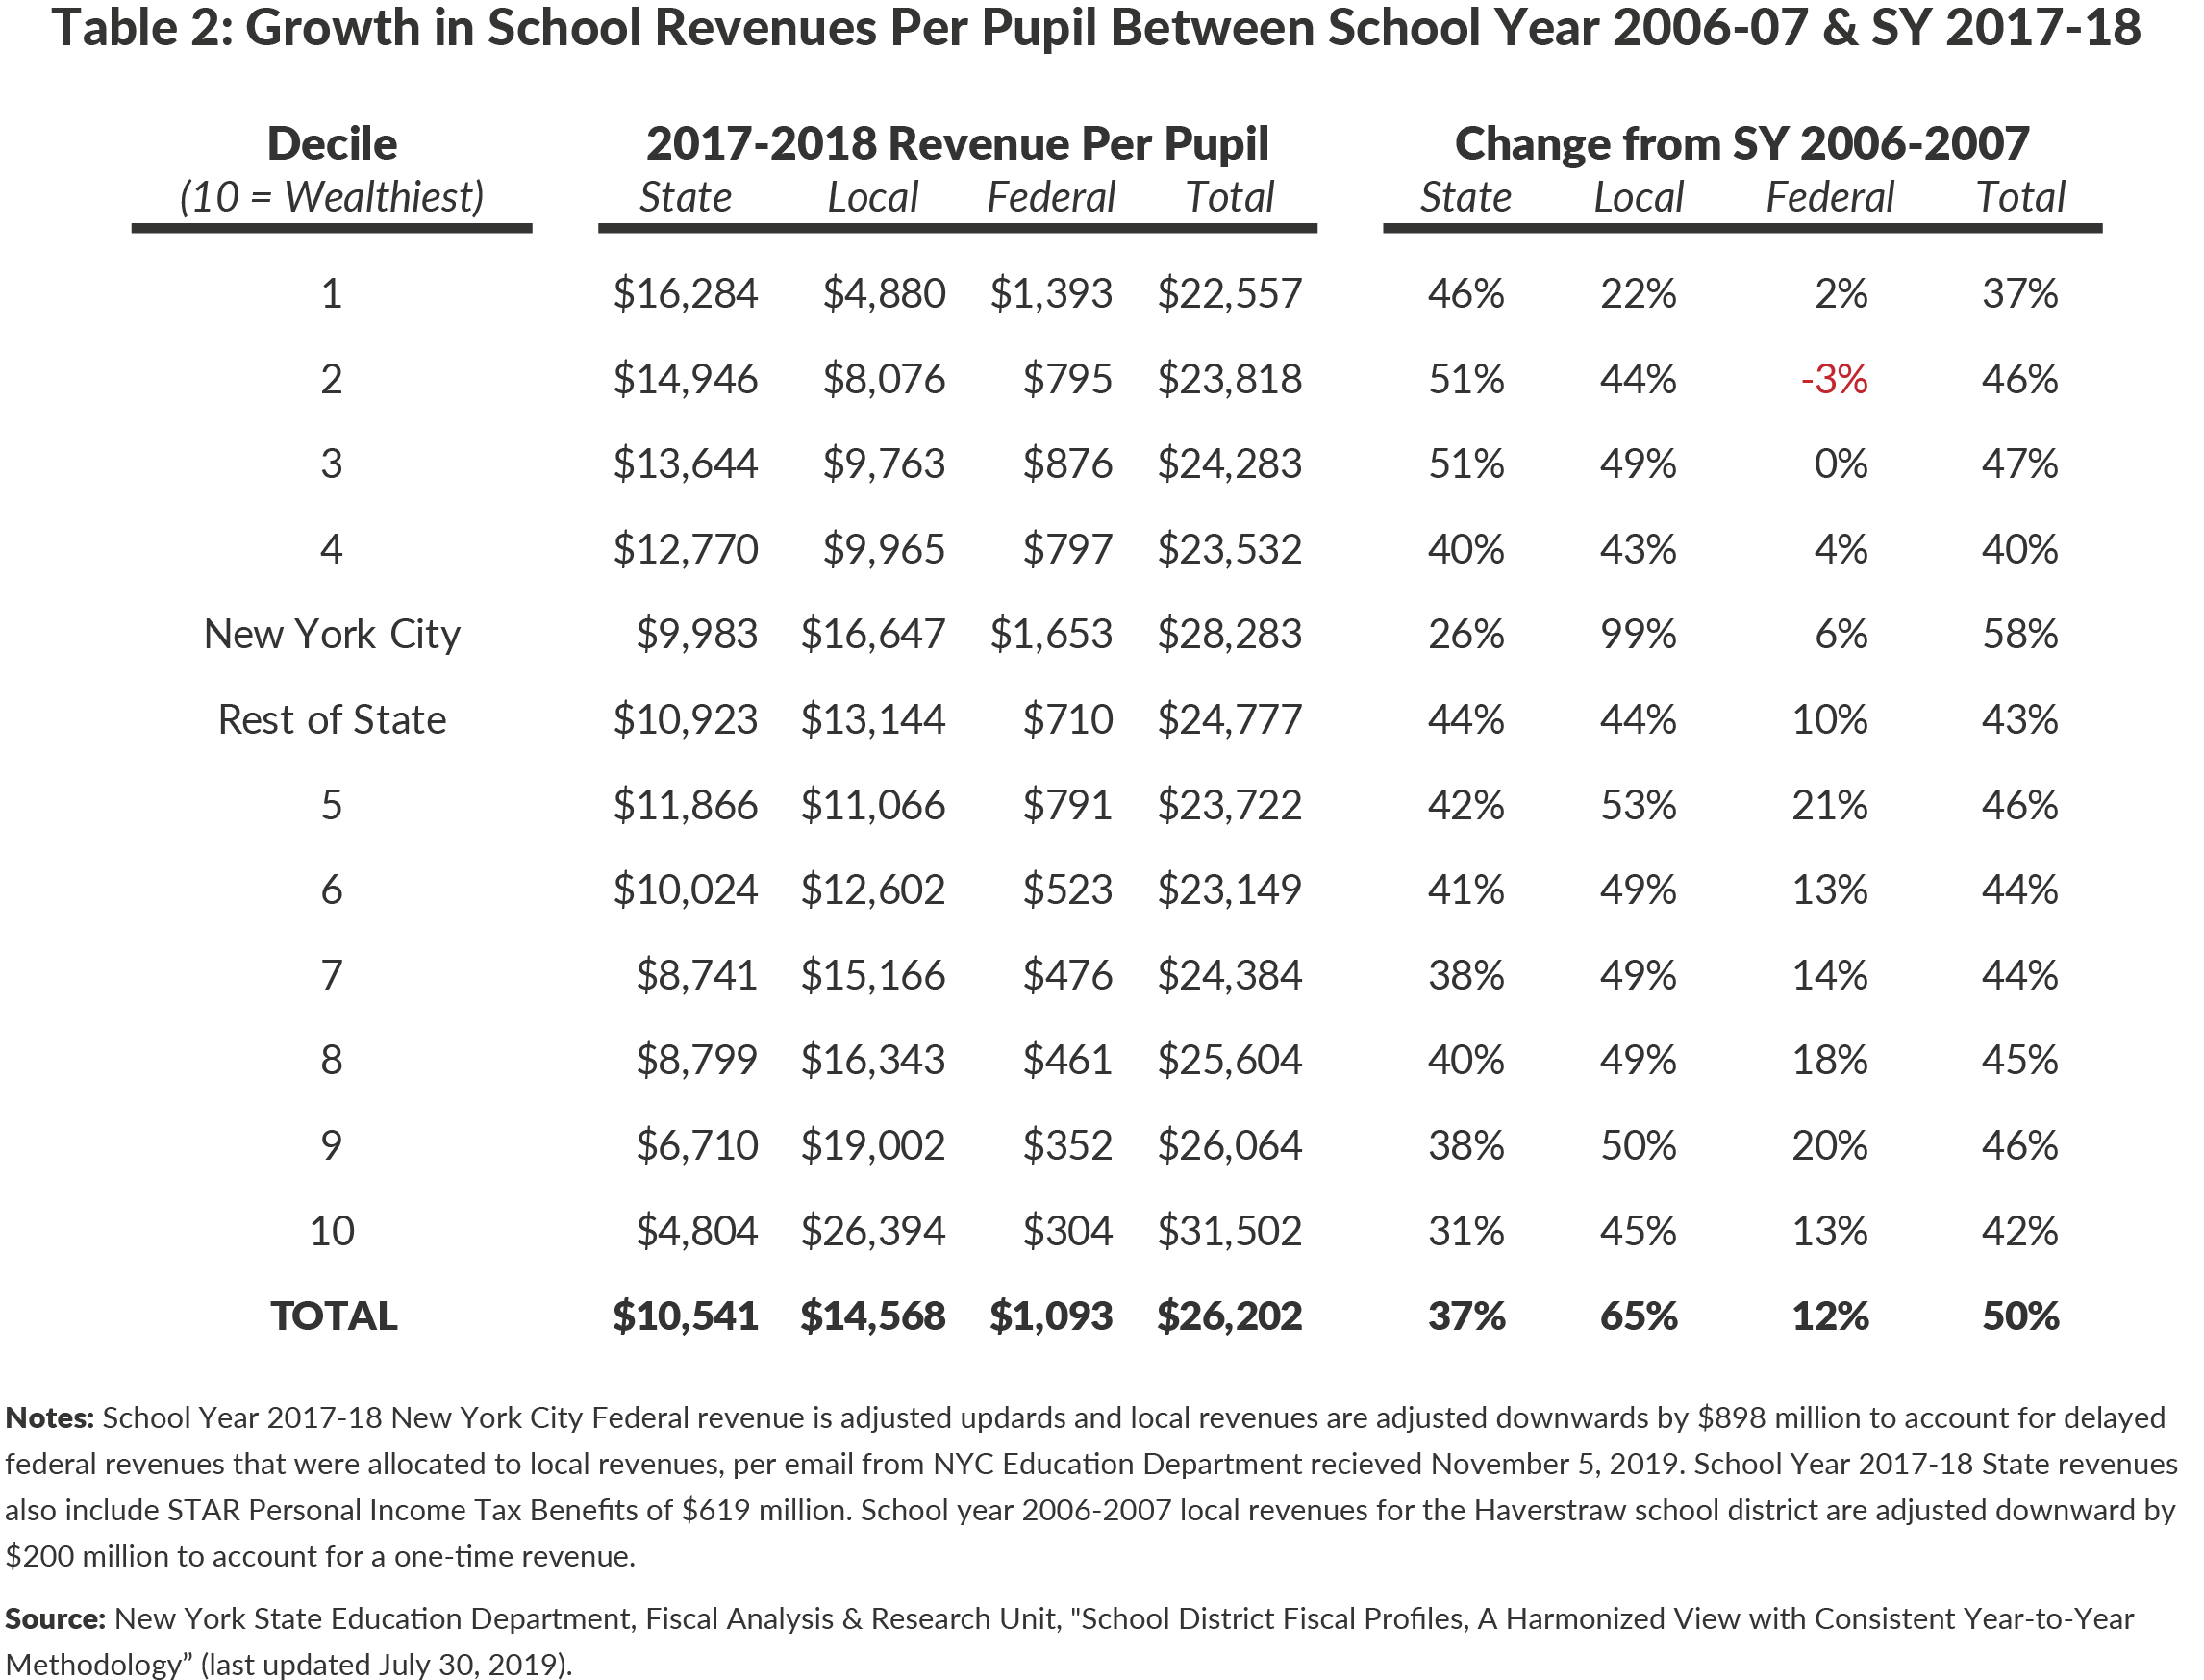
On a per pupil basis state aid increased 37 percent and local revenues increased 65 percent between school years 2006-2007 and 2017-2018. For this period state aid per pupil in New York City increased only 26 percent, slightly faster than inflation, while local revenues increased 99 percent.6 (See Table 2.) It is also important to remember that New York spends more per pupil than any other state in the nation, with every single district spending more than the national average.7 Total revenues in school year 2017-2018 were more than $26,000 per pupil.
4. In the aggregate New York State spends enough to provide all students with a sound basic education; however, State school aid is not targeted well enough to achieve this goal in all districts.
School districts in New York spent more than $72 billion in school year 2017-2018 using local, state, and federal funding. CBC estimates New York spent $13.6 billion more than necessary to fund an SBE as defined by the Foundation Aid Formula (the methodology is summarized in Appendix B). Many wealthy districts receive much more State aid than is needed. For example, 129 districts raise enough revenues from just local resources to fund an SBE and still received $1.6 billion in state aid in school year 2017-2018.
Based on this analysis, 25 districts lacked the resources necessary to fund an SBE in school year 2017-2018, and 21 of these districts are in the lowest wealth deciles. The total amount of funding needed to bring these districts’ funding to the level needed is less than $75 million, and approximately 80 percent of the shortfall is in the least wealthy decile.8
Please allow me to be clear. This does not mean that all students in districts with adequate funding are getting a proper education, or that the State’s calculation of how much it costs to provide an SBE is perfect. However, the majority of districts receive sufficient resources to fund an SBE. All districts would have the resources needed if state aid were distributed differently than the flawed Foundation Aid formula and other insufficiently need-based formulas dictate.
Conclusion
It is important to consider the larger economic and State fiscal context in any discussion of New York’s education spending. The United States and New York are enjoying the longest economic expansion ever. This has fueled large increases in education aid. Next year’s budget outlook is bleak—Medicaid spending is $4 billion over budget in the current year and forecast to be $3 billion over budget next year—which will put pressure on every major spending program.9 State reserves are barely 10 percent of what may be needed to compensate for recession-driven revenue losses.10 During the last recession, education aid decreased even with the enactment of a personal income tax surcharge. This surcharge continues to be in place; further increasing personal income tax rates will be challenging and will undermine New York competitiveness. Targeting school aid to those districts that need it to provide an SBE is one way the State can start to rein in spending in preparation for an economic downturn.
The State should revamp the Foundation Aid formula and other education aid formulas to properly account for local wealth and actual local funding; eliminate hold-harmless provisions and guaranteed minimum funding increases; and use the most up to date data available. These changes would direct aid to where it is needed most and ensure every district has the resources needed to fund an SBE. In addition, expense-based aids and other types of education aid– such as high tax aid– should be redirected towards those districts without the resources to provide a SBE.11 Taking responsible steps to reform and redirect state education spending would allow the State to set aside more in reserves, which in turn would increase the State’s ability to sustain education funding through the next recession. This is particularly important for high-needs districts, which are more dependent on state revenues.
This concludes my testimony, and I would be happy to answer any questions.
Appendix A

Appendix B: Methodology
This analysis uses data included in the School Year 2018 Enacted Budget School Aid Run and the 2017-18 Masterfile published by the New York State Education Department. These data are the best publicly available data that detail the calculations utilized in determining the costs of a sound basic education and state, local, and federal aid in every New York school district . The basic methodology employed in this analysis compares the total costs of a sound basic education to total revenues received by a school district.
- Costs for a sound basic education by district are determined by the addition of:
- The Foundation Amount in school year 2017-2018 enacted budget school aid runs multiplied by number of total aidable Foundation Aid pupils (TAFPU); plus
- Other necessary costs excluded from the Foundation Amount calculation pursuant to the successful school methodology and the Annual Finance Report (Form ST-3) for New York State Public Schools for school year 2017-2018.12
- 2017-2018 revenues available by district include:
- Local revenues, including School Tax Relief (STAR);
- Federal aid; and
- State aid.
Source: New York State Education Department, “Annual Finance Report (Form ST-3) for New York State Public Schools , ST-3 Data for Year Ending June, 2017” (accessed April 2019), https://stateaid.nysed.gov/st3/st3data.htm, and “Fiscal Supplement Methodology with Account Codes” provided on March 7, 2019 in response to a freedom of information law request.
Footnotes
- David Friedfel, A Better Foundation Aid Formula (Citizens Budget Commission, December 2016), www.cbcny.org/research/better-foundation-aid-formula.
- This results in wealthy districts receiving considerable Foundation Aid. See: David Friedfel, A Better Foundation Aid Formula (Citizens Budget Commission, December 2016), www.cbcny.org/research/better-foundation-aid-formula.
- Wealth deciles are based on the average of a district’s free and reduced price lunch share and census poverty share, divided by the district’s combined wealth ratio as determined by the New York State Education Department. The resulting figure is then indexed to the state average to determine a needs index. Source: CBC staff analysis based on data from New York State Education Department, Fiscal Analysis & Research Unit, “2019-2020 Enacted School Aid Files” (April 1, 2019).
- David Friedfel, “Ripe for Reform,” Citizens Budget Commission Blog (January 2, 2018), https://cbcny.org/research/ripe-reform.
- From June 2007 to June 2018 the consumer price index was 20.94 percent. Source: U.S. Bureau of Labor Statistics, CPI Inflation Calculator (accessed on November 19, 2019), www.bls.gov/data/inflation_calculator.htm.
- U.S. Bureau of Labor Statistics, CPI Inflation Calculator (accessed on November 19, 2019), www.bls.gov/data/inflation_calculator.htm.
- U.S. Census Bureau, Educational Finance Branch, “U.S. School Spending Per Pupil Increased for Fifth Consecutive Year,” U.S. Census Bureau Reports (press release, May 21, 2019), https://www.census.gov/newsroom/press-releases/2019/school-spending.html; and New York State Education Department, Fiscal Analysis & Research Unit, “Masterfile for 2017-18” (September 2019), http://www.oms.nysed.gov/faru/Profiles/profiles_cover.html.
- These figures differ from prior CBC analysis. These figures reflect comparisons of school year 2017-2018 receipts with the calculation of the costs of SBE in that year. The prior analysis trends actual receipts forward and compared to SBE calculation for school year 2019-2020.
- New York State Division of the Budget, FY 2020 Mid-Year Update (November 22, 2019), https://www.budget.ny.gov/pubs/archive/fy20/enac/fy20fp-en-myu.pdf.
- David Friedfel, “NYS Revenues in a Recession; Quantifying the Potential Shortfall” Citizens Budget Commission Blog (March 19, 2019), https://cbcny.org/research/nys-revenues-recession.
- High tax aid is allocated based on historical shares and disproportionately benefits wealthy districts. See: David Friedfel, “Ripe for Reform: $466 Million in Education Aid,” Citizens Budget Commission Blog (January 2, 2018), https://cbcny.org/research/ripe-reform.
- New York State Education Department, “Annual Finance Report (Form ST-3) for New York State Public Schools , ST-3 Data for Year Ending June, 2018” (accessed November 2019), https://stateaid.nysed.gov/st3/st3data.htm, and “Fiscal Supplement Methodology with Account Codes” provided on March 7, 2019 in response to a freedom of information law request.