Testimony to the U.S. Commission on Civil Rights
Before the New York Advisory Committee on the Lack of Equality of School Funding in New York State.
Hello, and thank you for the opportunity to testify today. I am David Friedfel, Director of State Studies for the Citizens Budget Commission (CBC). CBC is a nonprofit, nonpartisan think tank, dedicated to achieving constructive change in the finances and services of New York City and New York State government. Due to education’s vital role, CBC has long advocated for all students to have access to a sound basic education (SBE) as required by the New York State Constitution. An SBE should provide the next generation with the knowledge and skills they need to fulfill their potential, be productive members of society, and improve the state’s economic and civic future.
In an attempt to meet the constitutional requirement, state leaders reformed state education aid in 2007. The State consolidated several funding streams into the “Foundation Aid” formula to distribute aid so that the neediest districts would be equipped to meet the constitutional requirement. However, political compromises and reluctance to decrease aid to wealthy districts resulted in flaws in the design of the formula. As a result—despite significant increases in state aid and local revenues—not all districts have the resources to provide an SBE in 2020.
My testimony goes into detail on three key points:
- The Foundation Aid formula is flawed. Faulty calculations of local revenues and “hold harmless” provisions drive aid to some districts that is above and beyond what is needed to provide an SBE;
- Total education funding has increased significantly since Foundation Aid was created; and
- There are 29 districts that still do not have the resources to provide an SBE despite statewide spending that is $13 billion more than is needed to reach an SBE.
1. The Foundation Aid Formula is flawed
Foundation Aid—$18.4 billion of a total $27.3 billion in school year 2019-2020—was created to ensure that all school districts have the resources to provide an SBE.
The Foundation Aid formula has 4 main steps:
- Determine how much it costs per student to provide an SBE in each district based on poverty, regional cost differences, and other characteristics;
- Calculate how much the local taxpayers should contribute per student;
- Determine how many students there are per district, with a heavier weight for students with disabilities; and
- Set the foundation aid payable amount, subject to phase-in factors and minimum and maximum increases.
The Foundation Aid formula inequitably allocates aid by use of arbitrary adjustments, outdated data, and inconsistent local share calculations; these flaws were built into the formula from the beginning as a political compromise to assuage concerns of suburban politicians.1
The formula overestimates the need for state aid to wealthy districts and results in higher than appropriate annual aid increases. It is particularly problematic that the formula does not account for what districts actually contribute, instead using six different methods to calculate a theoretical local contribution.2 The result is to understate some districts’ actual local funding, thereby overstating state aid needed to fund an SBE.
For example, the wealthiest decile of districts are on track to spend $1.9 billion more than needed to fund an SBE in school year 2020. These districts, which on average spend more than $33,000 per student, receive $475 million in state aid, and the Foundation Aid formula calculates they are due an additional $67 million from the State. One should note that the calculation of total funding needed to provide an SBE has similar limitations, leading to overstating the cost of providing an SBE in some districts and understating it in others.3
Over time these problems have been exacerbated by a prohibition against decreases—even in cases of declining enrollment or increasing wealth—and an artificial limitation on aid growth regardless of increasing enrollment or need. Districts that are shortchanged cannot catch up while “overfunded” districts continue to get automatic increases.
In addition to Foundation Aid, other forms of school aid total $8.9 billion and also distribute too much aid to wealthy districts. For example, Library, Textbook, and Software Aids total $240 million annually and do not take account of district wealth at all– providing the exact same amount of aid per student in every district. Another category of aid, High Tax Aid, specifically targets $223 million in additional State aid to wealthy districts.4
2. Total education funding has increased significantly since Foundation Aid was created
Focusing on just changes in state aid ignores an important fiscal reality of school district funding. Districts in New York are funded through a combination of state, local, and federal resources. And frequently lost in the discussion on educational inequities is how much education spending has increased since school year 2006-2007. Between school year 2006-2007 and 2016-2017, total school district revenues increased $20 billion, or 40 percent, double the inflation rate.5 State education aid increased 30 percent, or $6.5 billion, and local revenues increased 54 percent, or $13.3 billion, including a 99 percent increase in local revenues in New York City. The increases in State aid were concentrated in the least wealthy districts, while local aid increased relatively evenly outside of New York City. Federal aid growth was more variable, but it represents a comparatively small share of school district revenues. (See Table 1.)
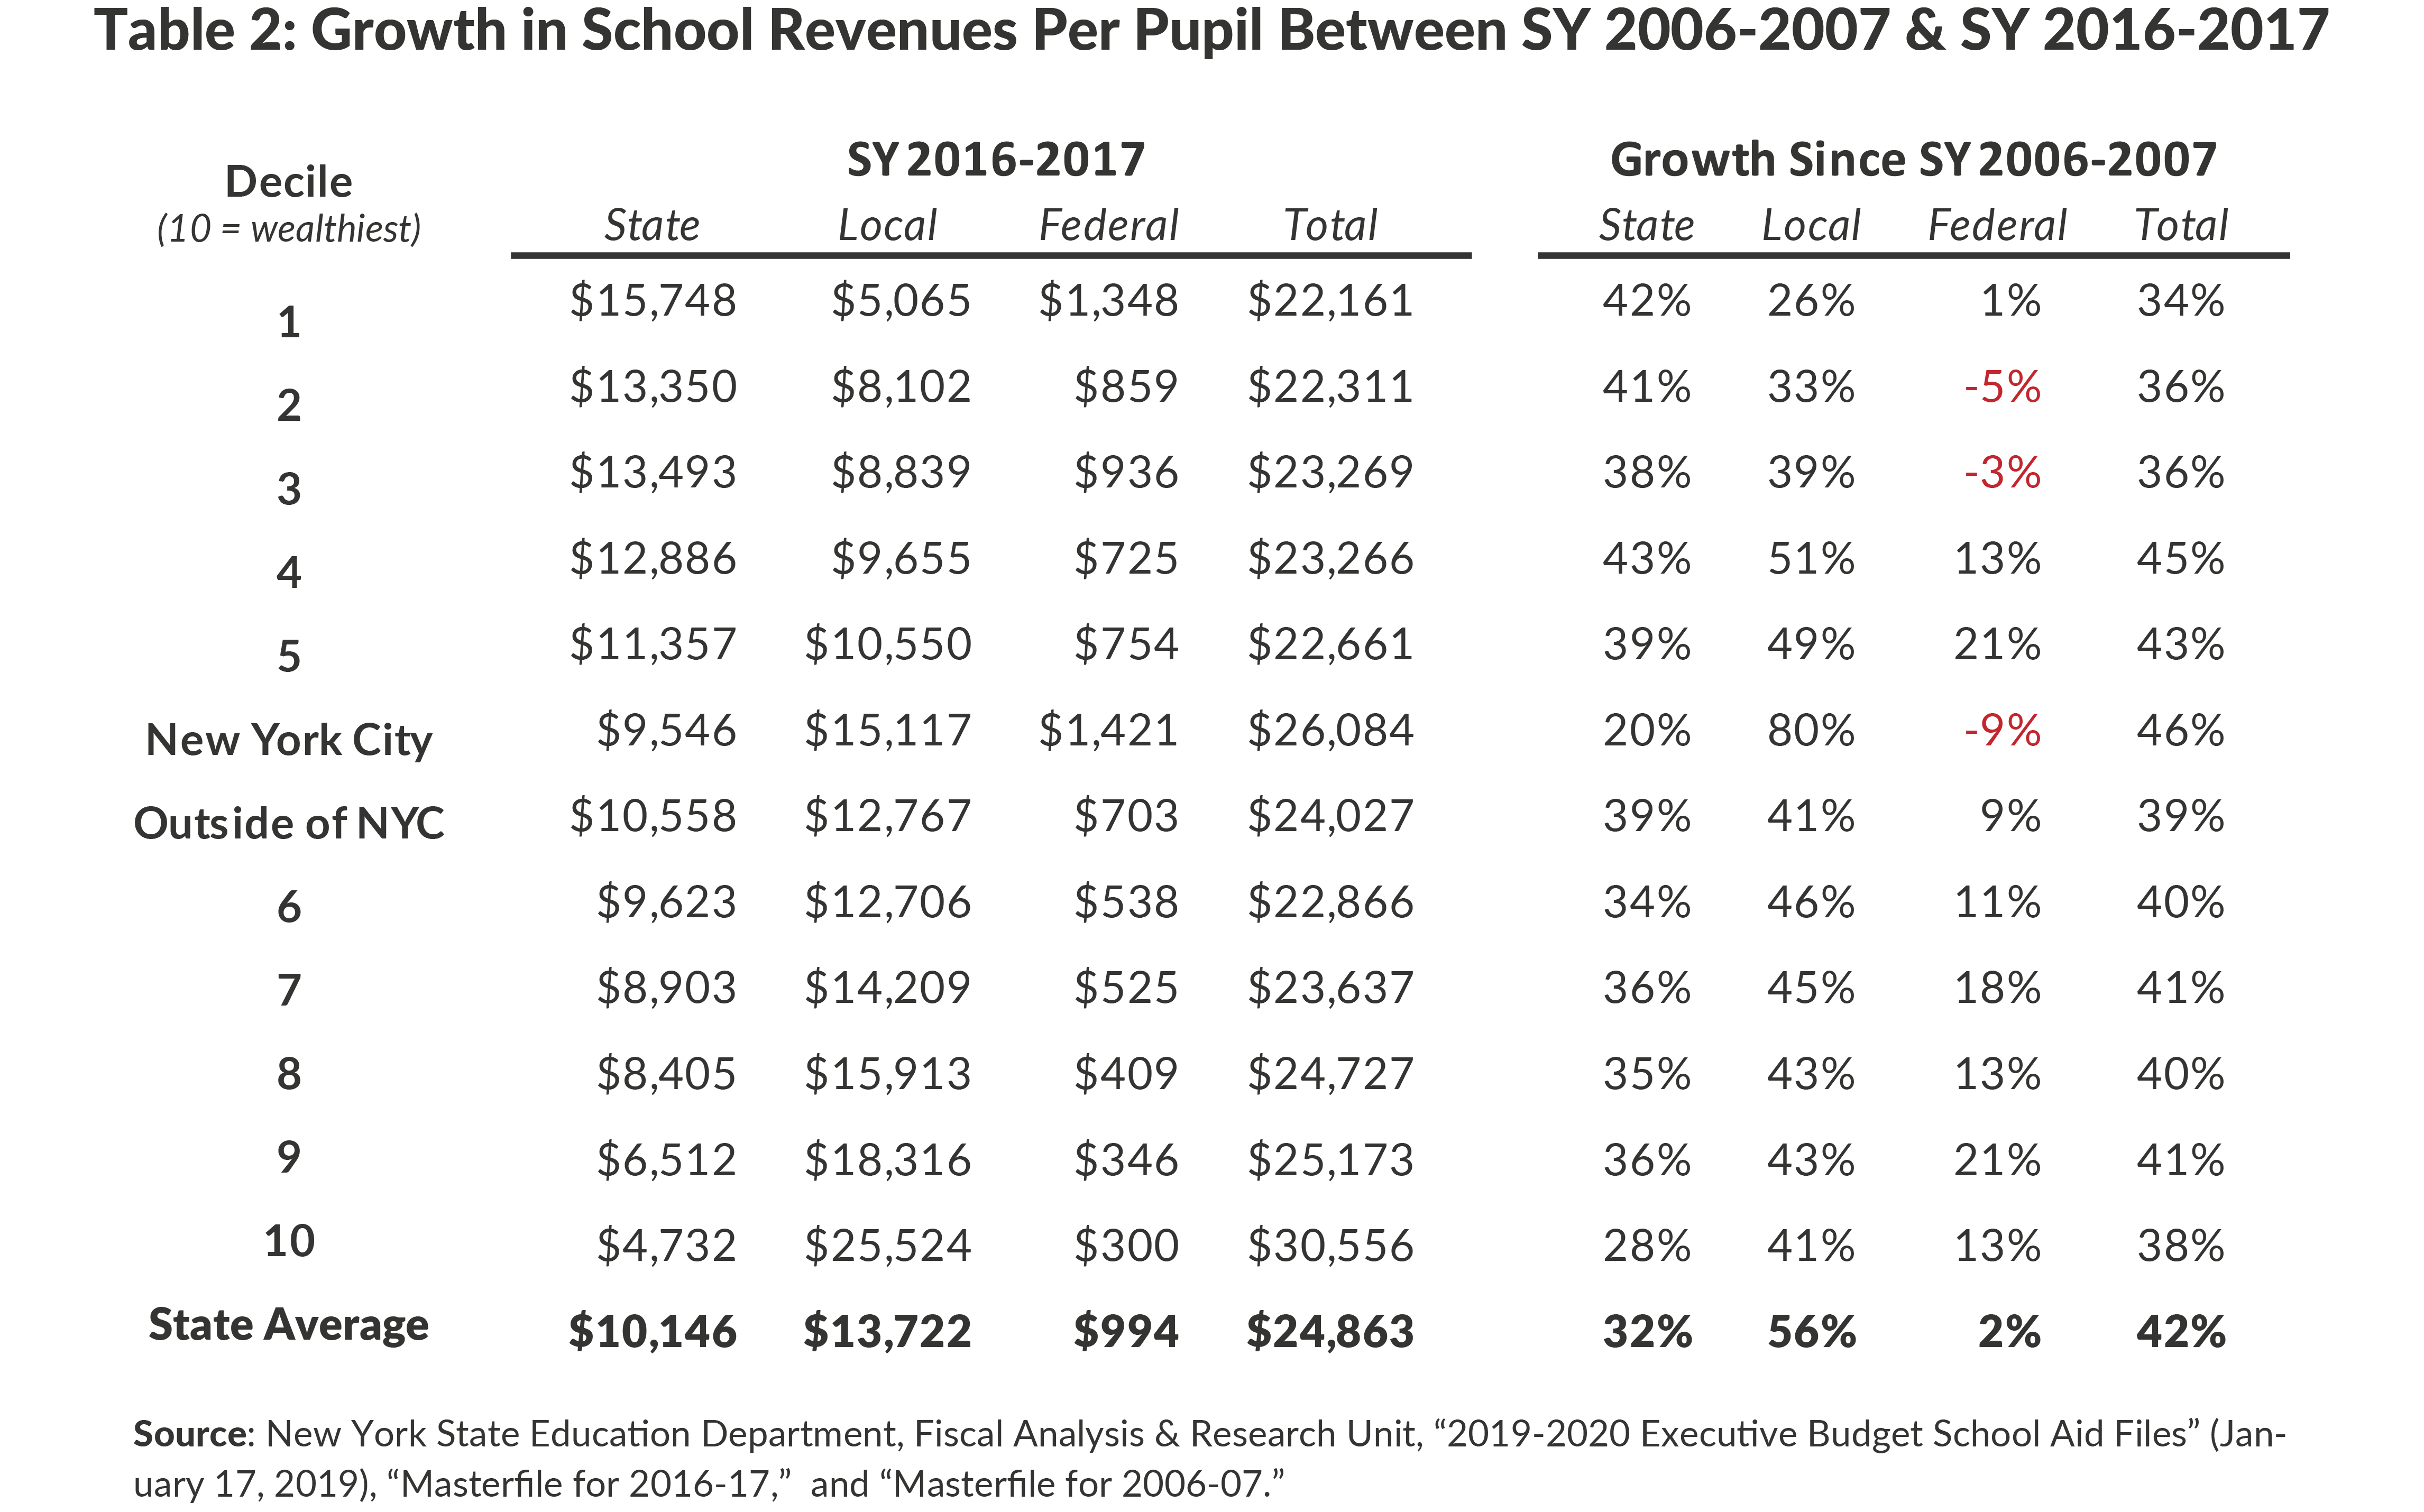
On a per pupil basis, State aid increased 32 percent and local revenues increased 56 percent between school years 2006-2007 and 2016-2017. For this period State aid per pupil in New York City increased only 20 percent, equal to inflation, while local aid increased 80 percent.6 (See Table 2.) It is also important to remember that New York spends more per pupil than any other state in the nation, with every single district in the state spending more than the national average.7 Total revenues in school year 2016-2017 were more than $24,000 per pupil.
Please refer to the tables in my written testimony for more details, or you can visit our website- www.cbcny.org- for an interactive map allowing users to see the increases in aggregate and per pupil aid for every district in the state.
3. In the aggregate New York State spends enough to provide all students with a sound basic education; however, State school aid is not targeted well enough to achieve this goal in all districts
School districts in New York are on track to spend more than $73 billion in school year 2019-2020 using local, State, and federal revenues. Based on CBC’s analysis, New York will spend $13 billion more than necessary to fund an SBE, as defined by the Foundation Aid Formula (the methodology is summarized in Appendix B – but essentially we compared the cost of an SBE as calculated by the Foundation Aid formula to the actual revenues received from all sources, by school district).8 Many wealthy districts receive much more aid than is needed. For example, 165 districts raise enough revenues from just local resources to fund an SBE and still receive almost $2 billion in State aid.
Based on this analysis, 29 districts will lack the resources necessary to fund an SBE in school year 2020. The total amount of funding needed to bring these districts’ funding to the level needed is less than $83 million.9
Please allow me to be clear. This does not mean that the state’s calculation of how much it costs to provide an SBE is perfect or that all districts with sufficient funding are actually providing students with the quality education we all desire. However, it does mean that the vast majority of districts receive enough total resources according to the state’s calculation. Most importantly, all districts would have the resources needed if State aid was distributed differently than the flawed Foundation Aid formula dictates.
Conclusion
It is important to consider the larger economic and state fiscal context in any discussion of the future of education spending in New York State. The United States and New York are enjoying the longest economic expansion in generations. This has fueled large increases in education aid. With economic risks on the horizon and state reserves barely 10 percent of what may be needed to compensate for recession-driven revenue losses, targeting school aid to those districts that need it to provide an SBE is even more important. During the last recession, education aid decreased even with the enactment of a personal income tax surcharge.
Therefore, the state’s education interests would be best served by significantly revamping the Foundation Aid formula and other education aid formulas to properly account for local wealth and actual local funding; eliminate hold-harmless provisions, and minimal growth rates; and use the most up to date data available. These changes would direct aid to where it is needed most, to ensure every district has the resources needed to fund an SBE. It also would allow the state to set aside more in reserves to increase the likelihood that state education funding could be sustained through the next recession.
Download Testimony
Testimony to the United States Commission on Civil RightsAppendix A

Appendix B – Methodology
This analysis uses data included in the School Year 2020 Executive Budget School Aid Run and the 2016-17 Masterfile. These data are the best publicly available data that detail the calculations utilized in determining the costs of a sound basic education and State aid in every school district in the state. The basic methodology employed in this analysis compares the total costs of a sound basic education to total revenues received by a school district.
- Costs for a sound basic education by district are determined by the addition of:
- The Foundation Amount in school year 2019-2020 school aid runs and multiplied by number of total aidable Foundation Aid pupils (TAFPU); plus
- Other necessary costs excluded from the Foundation Amount calculation. This calculation includes: transportation; debt service; transfer to capital funds; operations and maintenance; and high cost public and private school pupils.
- Expenses for transportation; debt service; transfer to capital funds; and operations and maintenance; are taken directly from the Masterfiles and increased by the State Fiscal Year Composite Consumer Price Index of New York as reported by the New York State Division of the Budget.10
- Calculates total costs for high cost public and private school pupils using data provided in the school aid runs.
- Revenues available by district include:
- Local revenues
- For districts other than New York City, 2016-2017 local revenues increased by average property tax cap (includes STAR).
- Since New York City is not subject to the property tax cap, used figure from FY 2019 New York City Executive Budget (includes STAR).
- Federal aid
- Equal to 2016-2017 federal aid; assumes no change in federal revenues.
- State aid
- Subtracts State Enacted Budget school aid to arrive at current underfunding.
- Local revenues
Footnotes
- David Friedfel, A Better Foundation Aid Formula (Citizens Budget Commission, December 2016), www.cbcny.org/research/better-foundation-aid-formula.
- This results in wealthy districts receiving considerable Foundation Aid. See: David Friedfel, A Better Foundation Aid Formula (Citizens Budget Commission, December 2016), www.cbcny.org/research/better-foundation-aid-formula.
- For example, the regional cost index used to calculate the cost of an SBE has not changed since Foundation Aid was originally adopted, and the pupil needs index uses poverty statistics from 2000.
- David Friedfel, “Ripe for Reform,” Citizens Budget Commission Blog (January 2, 2018), https://cbcny.org/research/ripe-reform.
- U.S. Bureau of Labor Statistics, CPI Inflation Calculator (accessed on August 30, 2018), www.bls.gov/data/inflation_calculator.htm.
- U.S. Bureau of Labor Statistics, CPI Inflation Calculator (accessed on August 30, 2018), www.bls.gov/data/inflation_calculator.htm.
- U.S. Census Bureau, Educational Finance Branch, “U.S. School Spending Per Pupil Increased for Fifth Consecutive Year,” U.S. Census Bureau Reports (Press Release, May 21, 2019), https://www.census.gov/newsroom/press-releases/2019/school-spending.html; and New York State Education Department, Fiscal Analysis & Research Unit, “Masterfile for 2016-17” (September 2018), http://www.oms.nysed.gov/faru/Profiles/profiles_cover.html.
- New York State Education Department, School Year 2020 Executive Budget School Aid Run (January 16, 2019).
- All but three of these districts are in the less wealthy half of districts, and approximately half of the SBE shortfall is in Brentwood, Long Island, which is a majority-minority district (3 percent white).
- New York State Division of the Budget, FY 2020 Economic and Revenue Report (January 2019), p. 143, www.budget.ny.gov/pubs/archive/fy20/exec/ero/fy20ero.pdf.