Making the Grade
New York State Should Ensure that Massive School Funding Increase Drives Results
Introduction
Over the past 18 months, the pandemic has required students, families, teachers, school staff, and districts to contend with some of the greatest education challenges in recent history. These include disrupted and dislocated learning, staffing and logistical challenges, and shifting fiscal realities. These challenges have affected planning and will dramatically affect operations and pedagogy for the 2021-22 school year.
Last year, schools re-opened in September with little certainty of their fiscal outlook. The enacted State budget had an unsolved $8 billion gap that possibly would be narrowed by withholding or reducing aid to schools. Ultimately, the State’s fiscal picture improved, rendering cuts unnecessary. Stronger-than-expected tax receipts plus billions of dollars in federal aid—chiefly from the American Rescue Plan—reversed the State’s outlook.
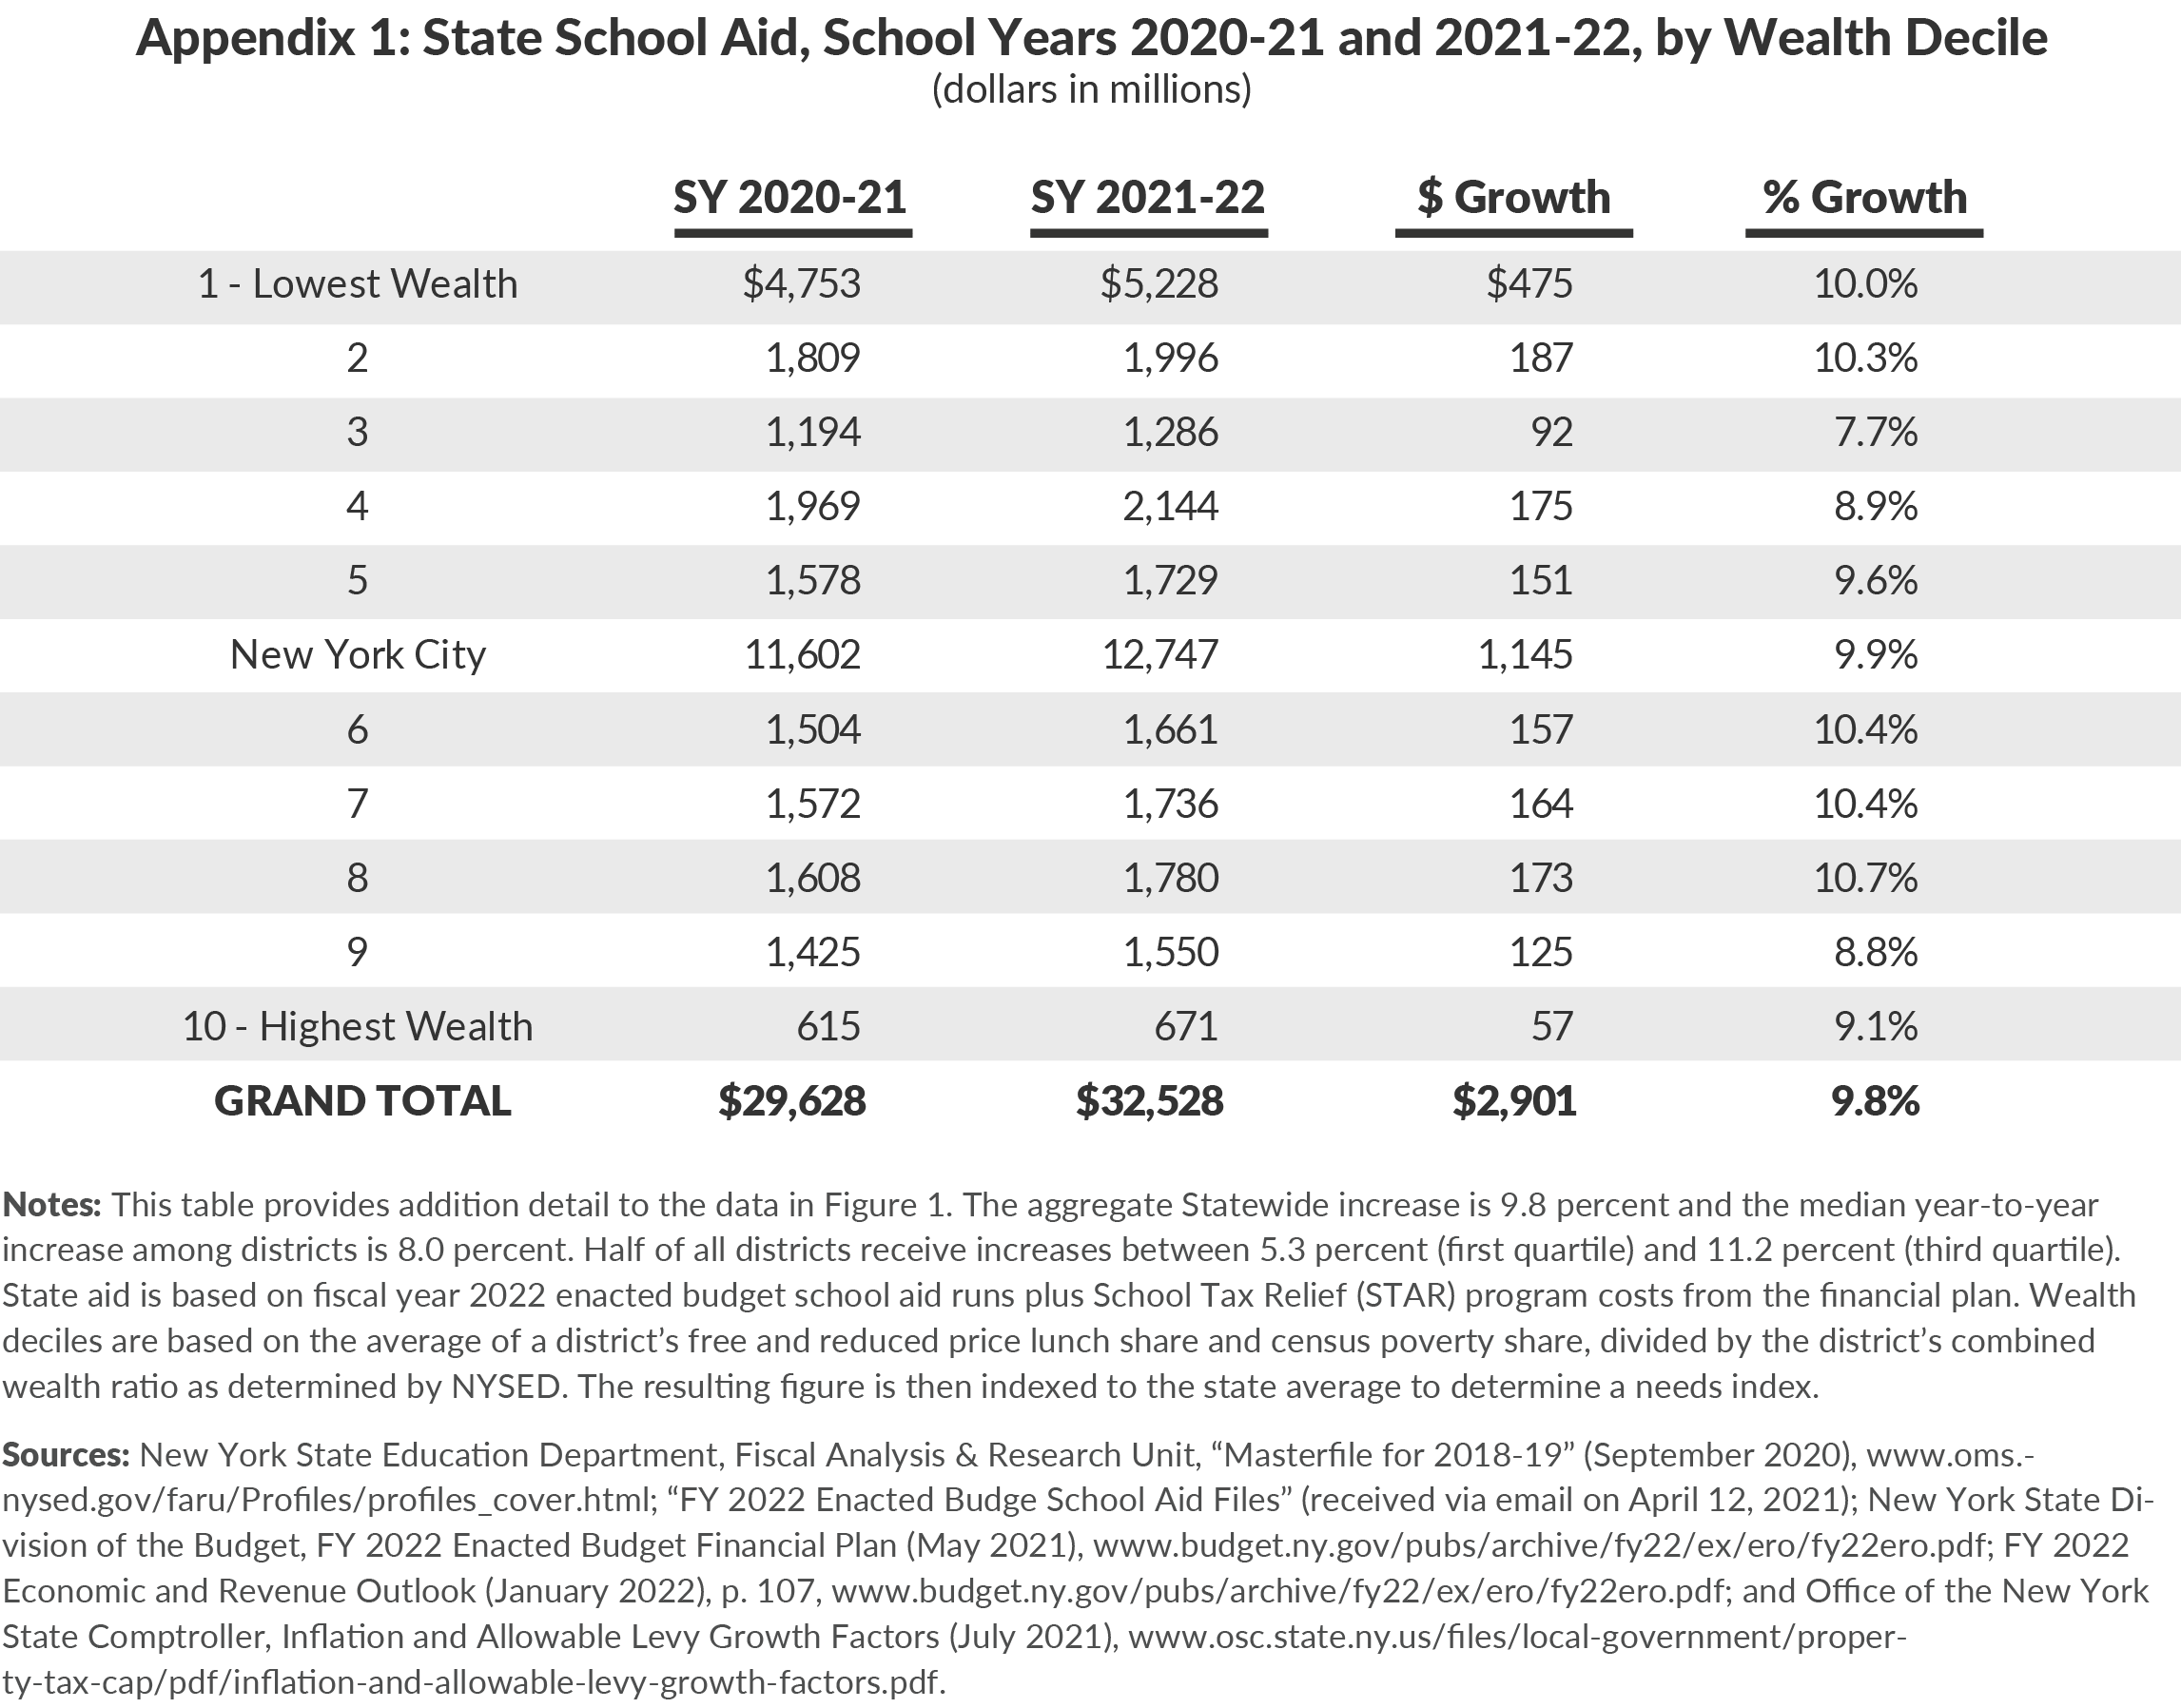
New York’s schools open this year slated to receive more aid than ever from the State plus $11.4 billion in one-time federal pandemic aid that can be spent over four years.1 With the pandemic significantly increasing educational needs and schools benefitting from an historic influx in additional funds, two issues become critically salient. First, the State increased its aid by $2.9 billion (a 9.8 percent increase). On a per pupil basis, the dollar increases in funding are greatest for the lowest wealth districts. However, year-to-year growth rates are approximately even across wealth deciles; funding increases range from 7.7 percent to 10.3 percent for the three lowest wealth deciles of districts and from 8.8 percent to 10.7 percent for the three highest wealth deciles.2
Second, the new funding is not accompanied by an adequate management, oversight, and accountability process. The State should take significant steps to ensure that the increases in recurring State and non-recurring federal funds drive substantial improvements in educational outcomes. For the near term, the State should be tracking and publicly reporting key data and holding districts accountable for addressing the pandemic’s negative impacts, including mitigating learning loss and ensuring a healthy return to school. On an ongoing basis, the State should manage, expect, and hold districts accountable to improve achievement and reduce educational disparities, using data that it makes publicly available.
State Aid Increases 9.8 Percent for the 2021-22 School Year
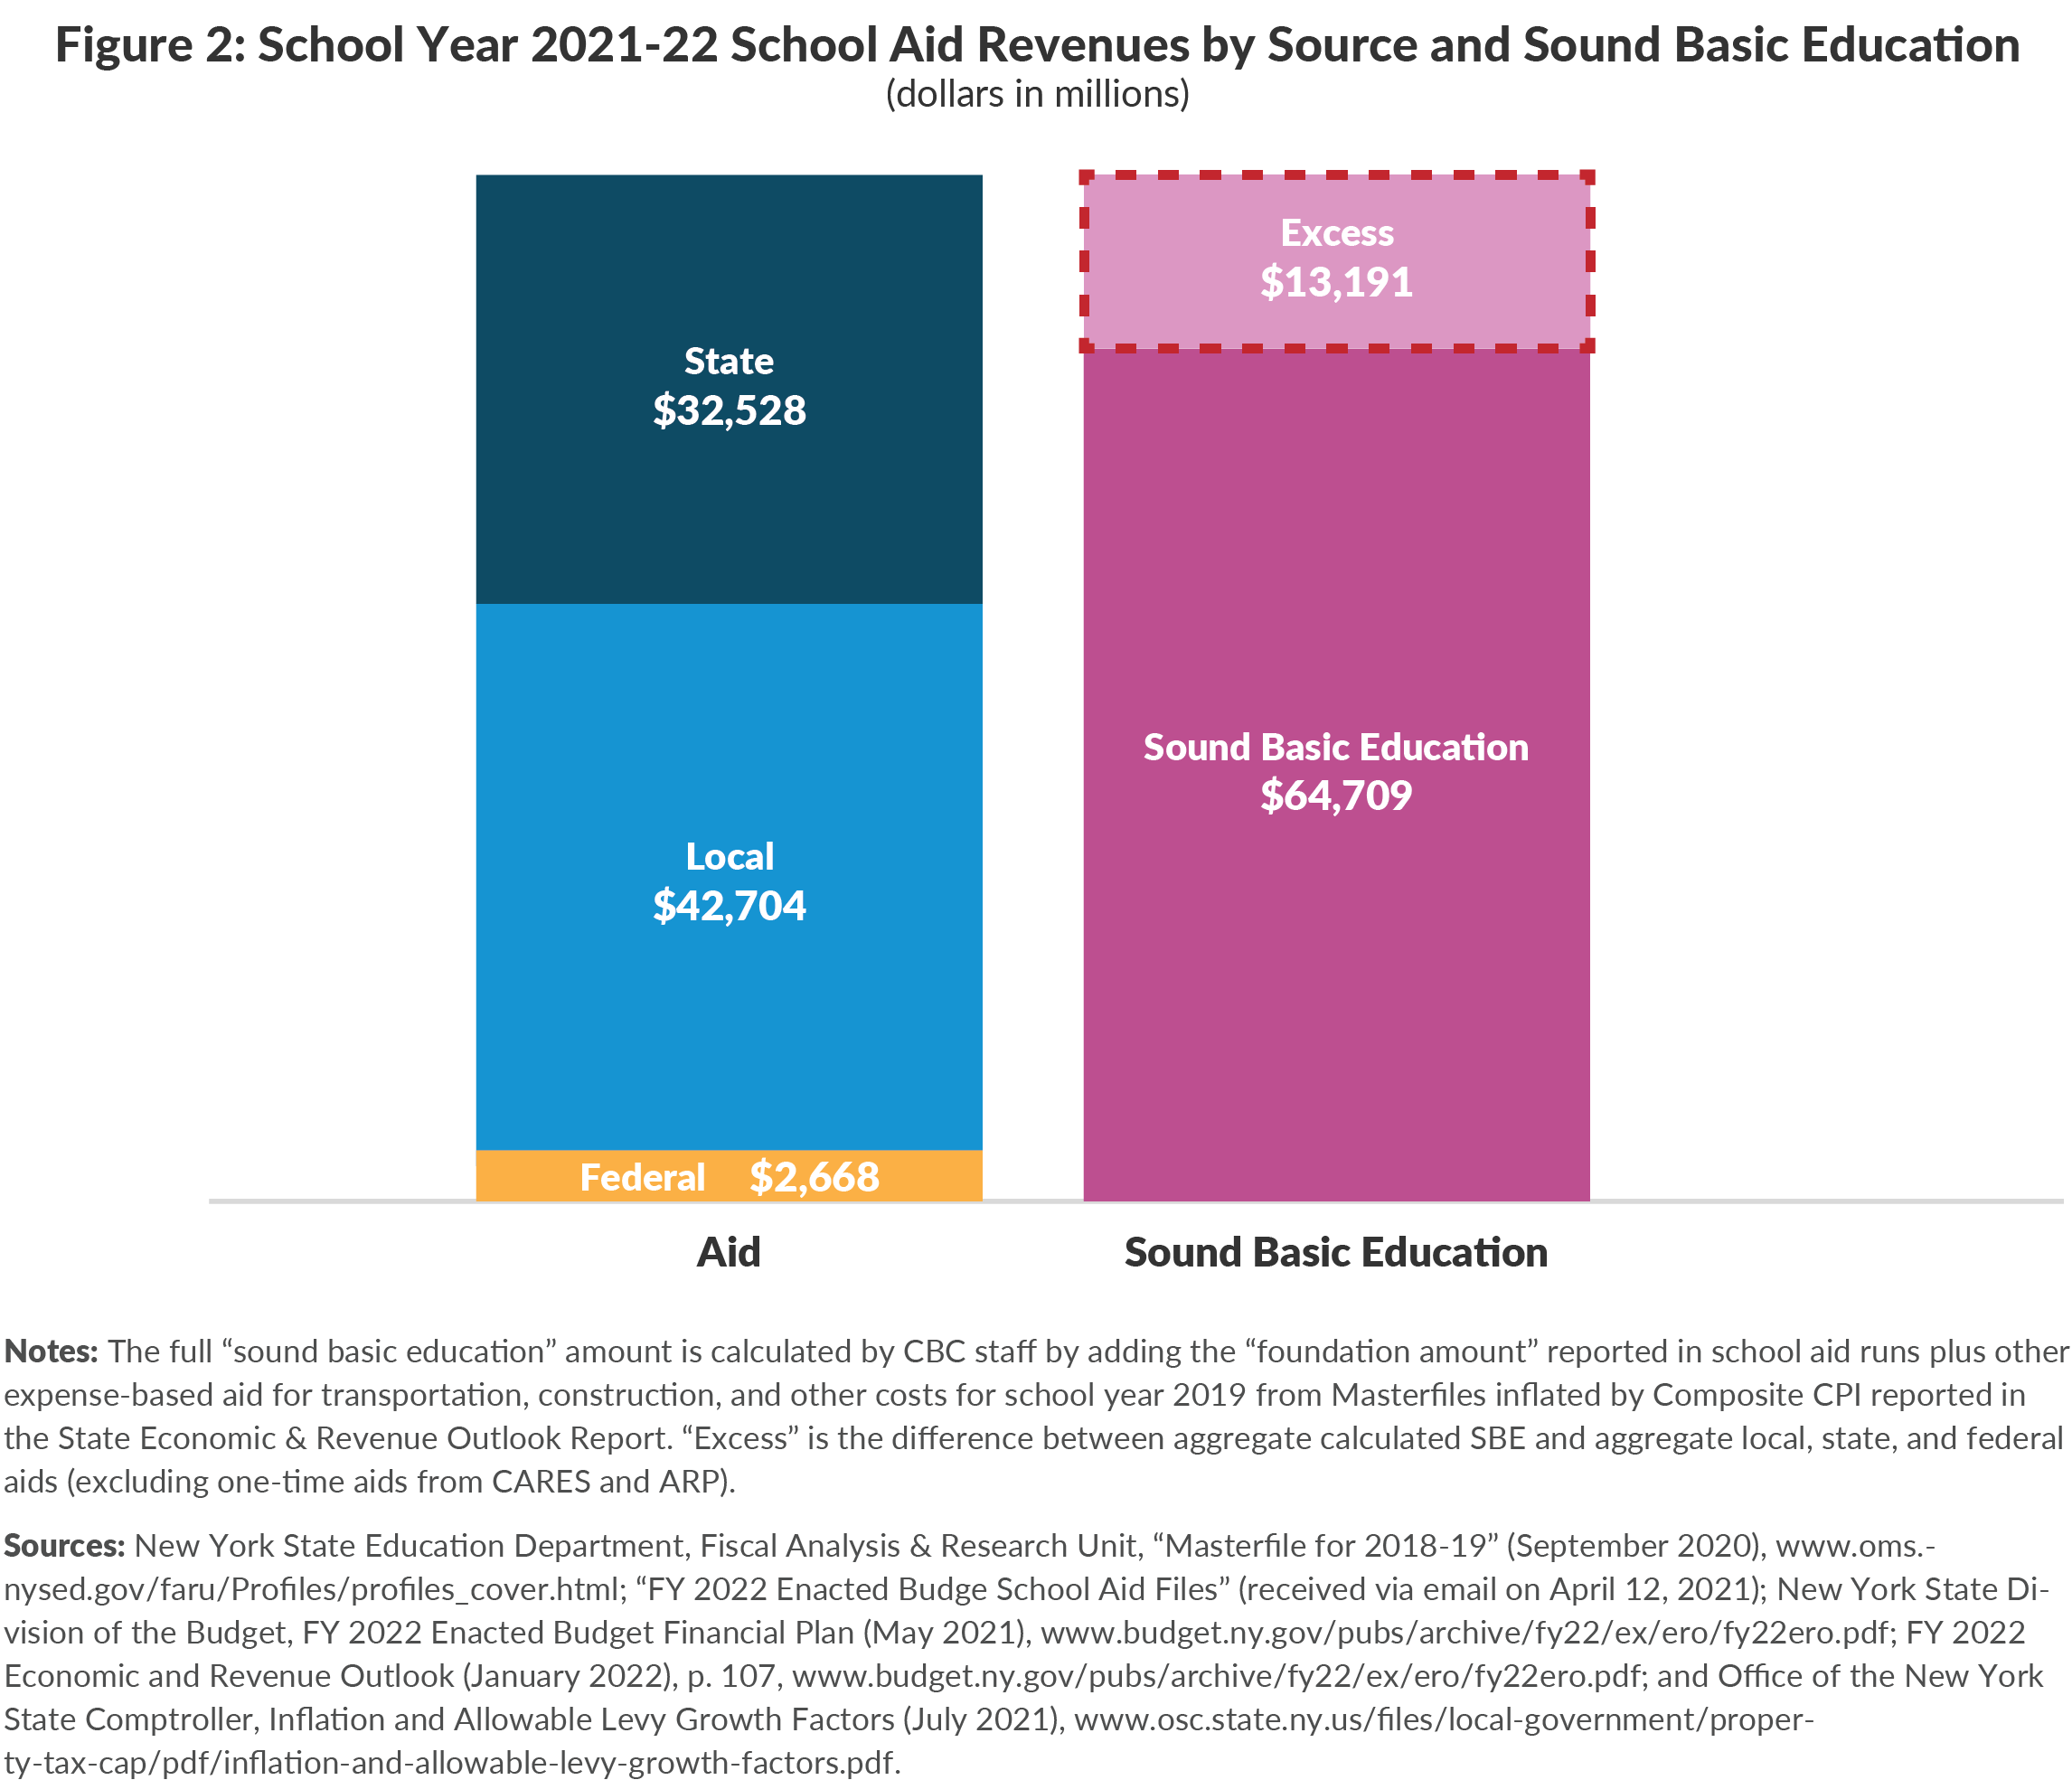
School aid comprises the largest portion of State funds in the budget every year. In the 2021-22 school year, State school aid will total $32.5 billion, which is a $2.9 billion (9.8 percent) increase over 2020-21. In addition to State aid, recurring school district support comes from local and federal resources. Local revenues—derived principally from property taxes—will be roughly $42.7 billion, and federal aid from annual recurring streams will provide approximately $2.7 billion.3 These federal, State, and local resources total approximately $77.9 billion, a 3.6 percent increase from the previous year. (See Table 1.)
Districts Will Receive $11.4 billion in Extraordinary Federal Aid to Support the 2021-22 and Subsequent School Years
Approximately $11.4 billion of the $13 billion in extraordinary federal one-time education funding from Coronavirus Response and Relief Supplemental Appropriations (CRRSA, nearly $4 billion) and the American Rescue Plan (ARP, $9 billion) will flow from the State to districts, with the balance of used for specific purposes and administration. The $11.4 billion is allocated to districts in this year’s school aid calculations, and will be used by districts over a four-year period.4

State Aid Increases at Uniform Growth Rates Across Income Deciles
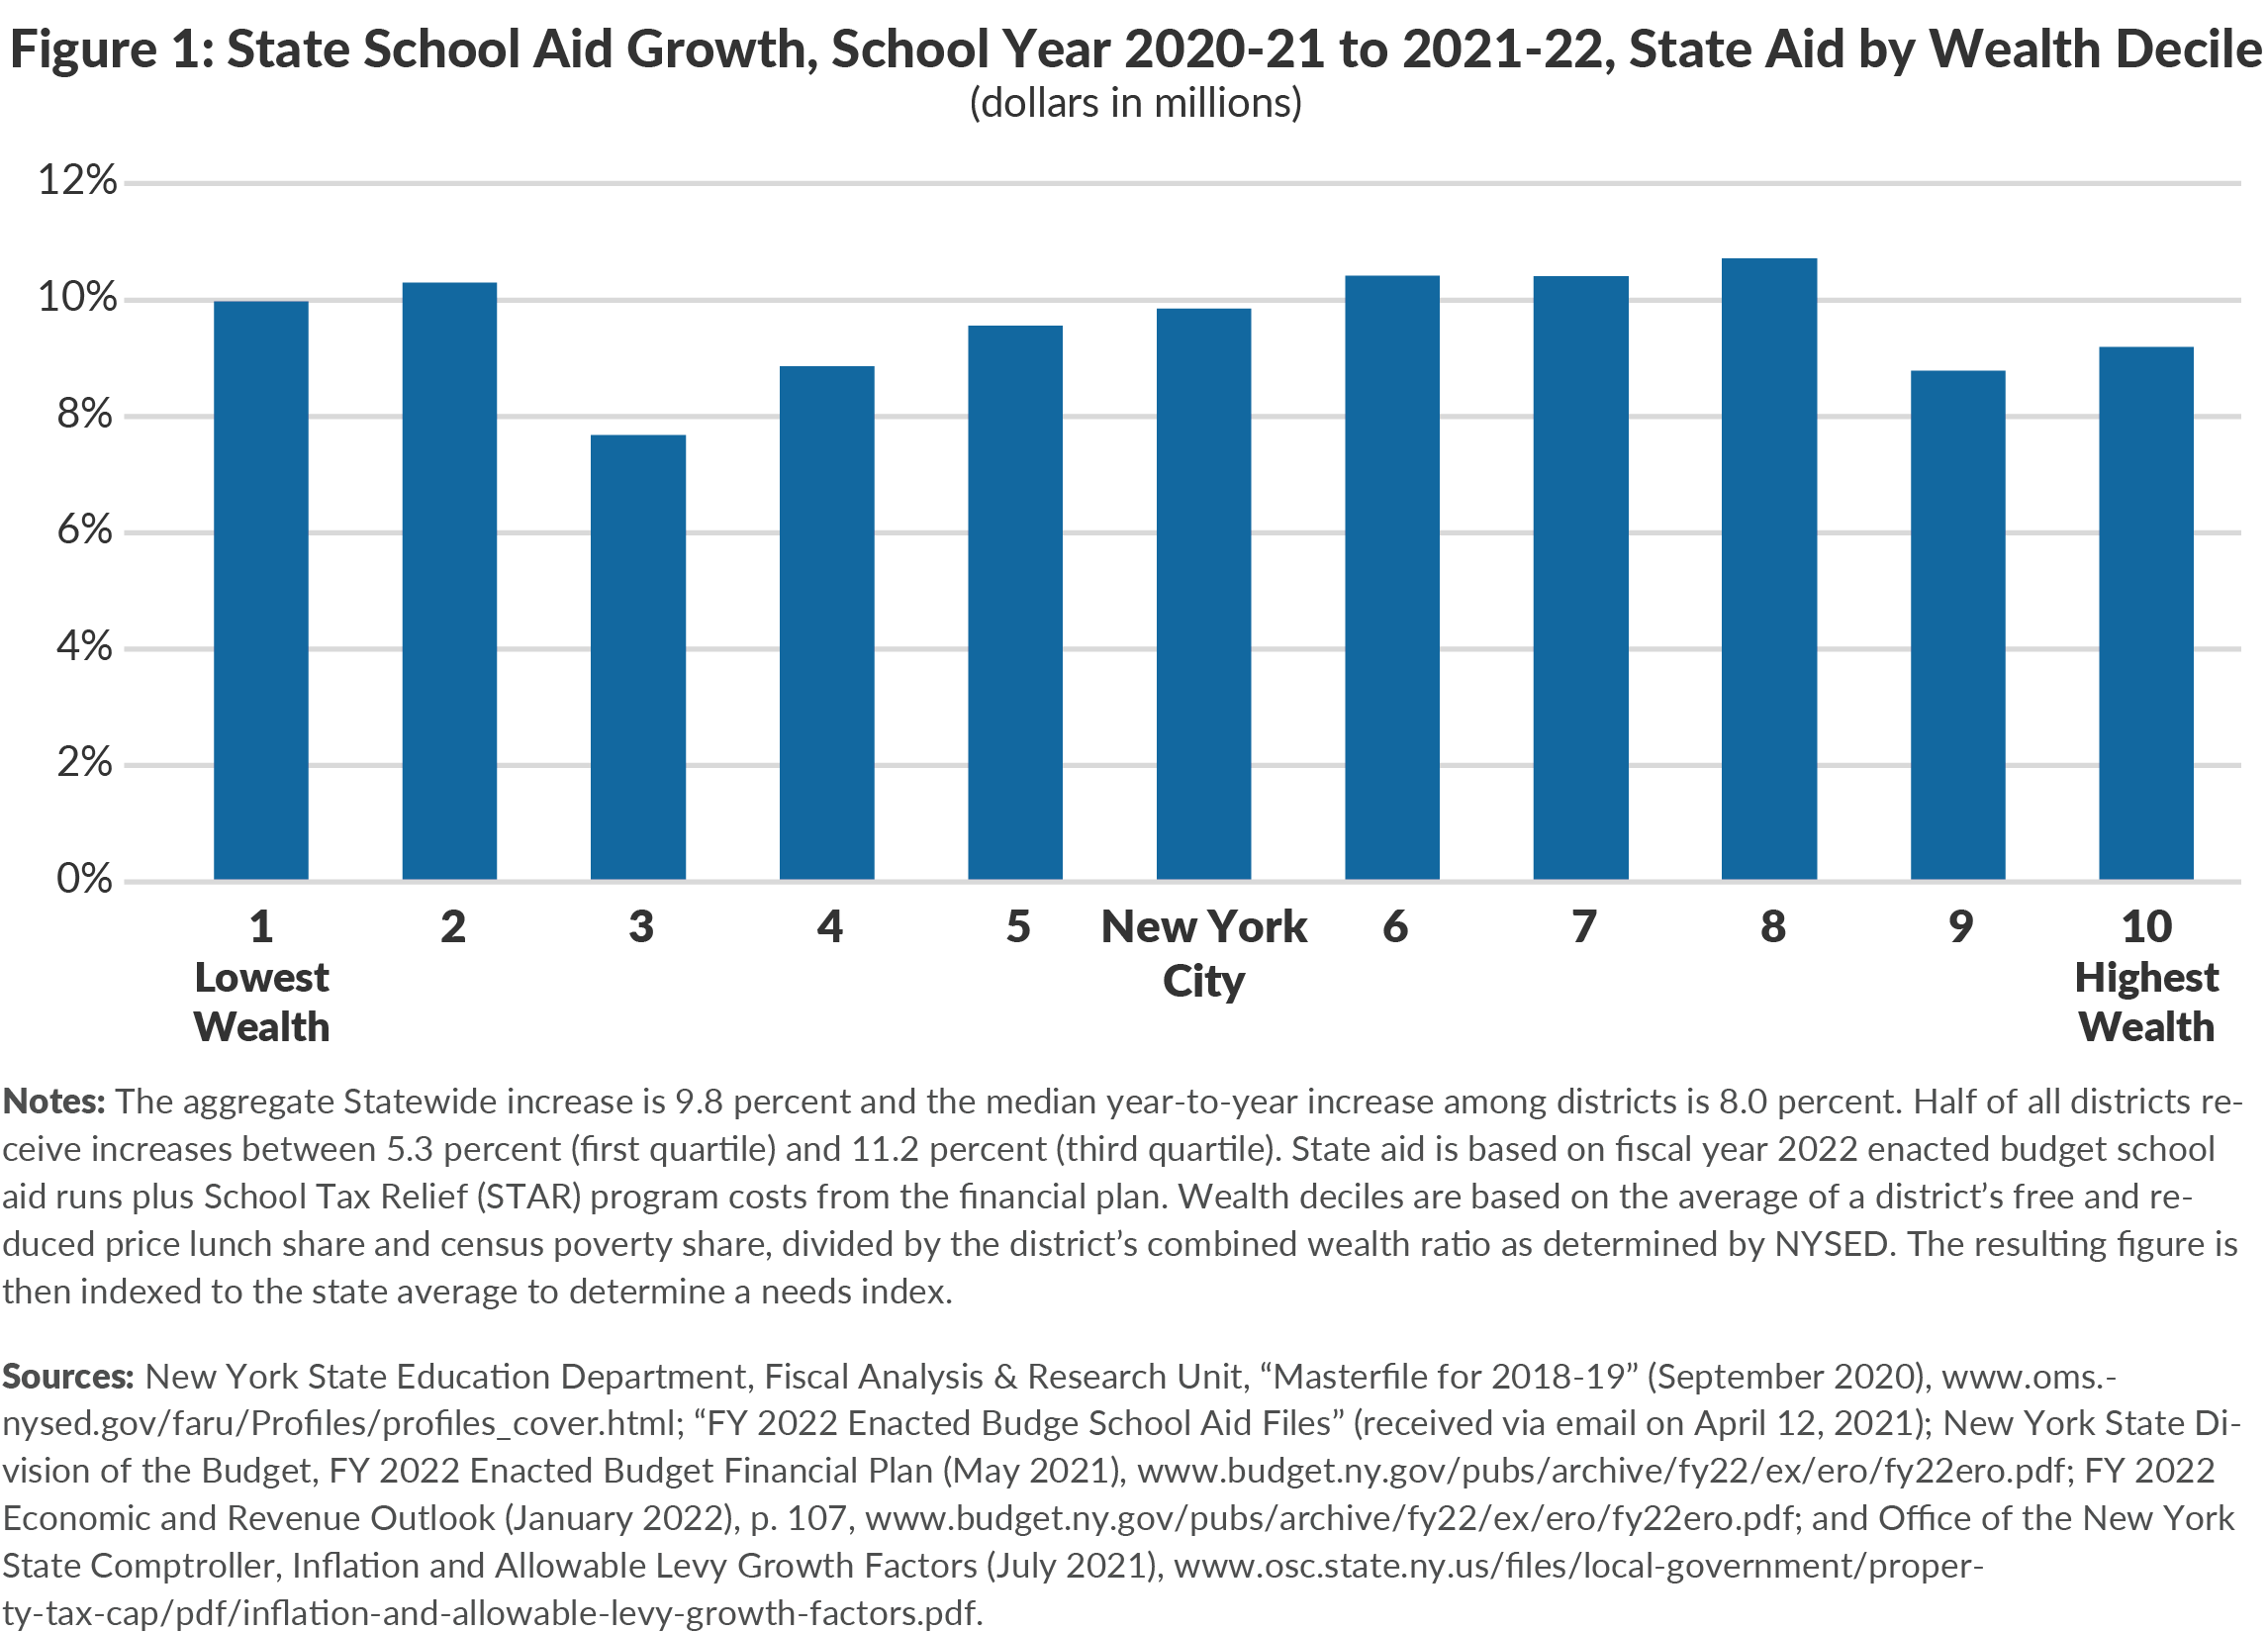
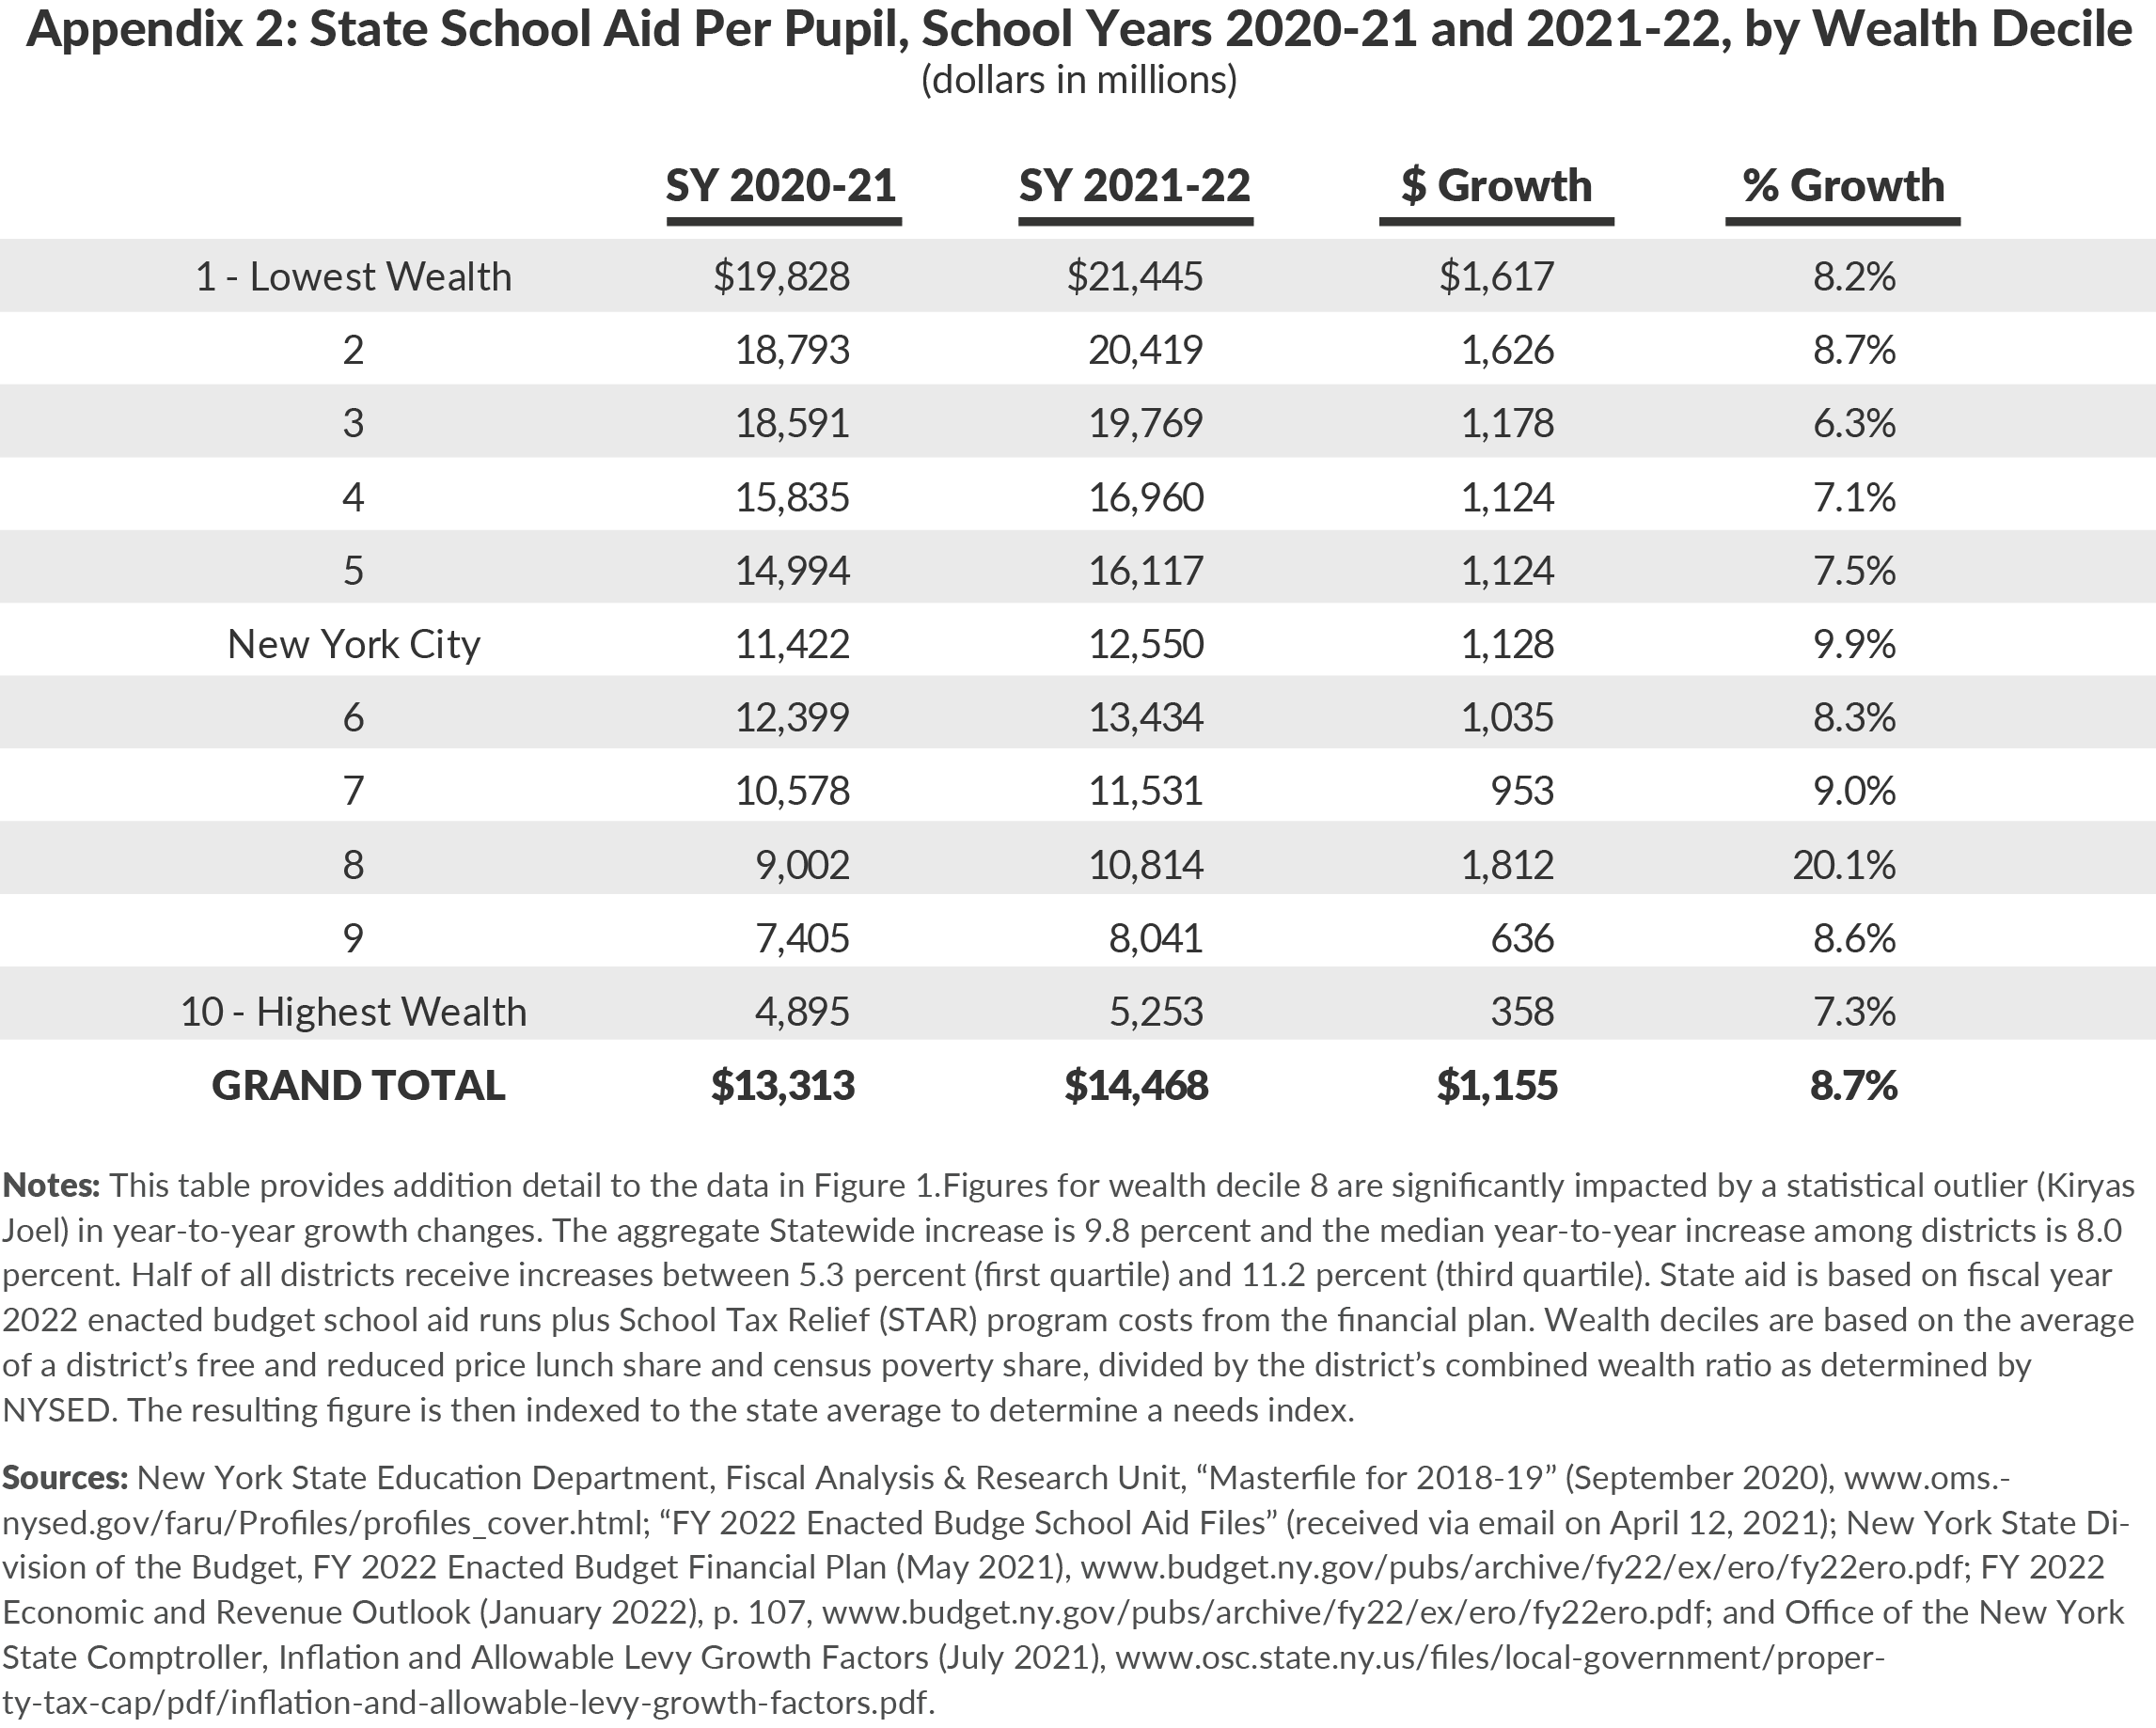
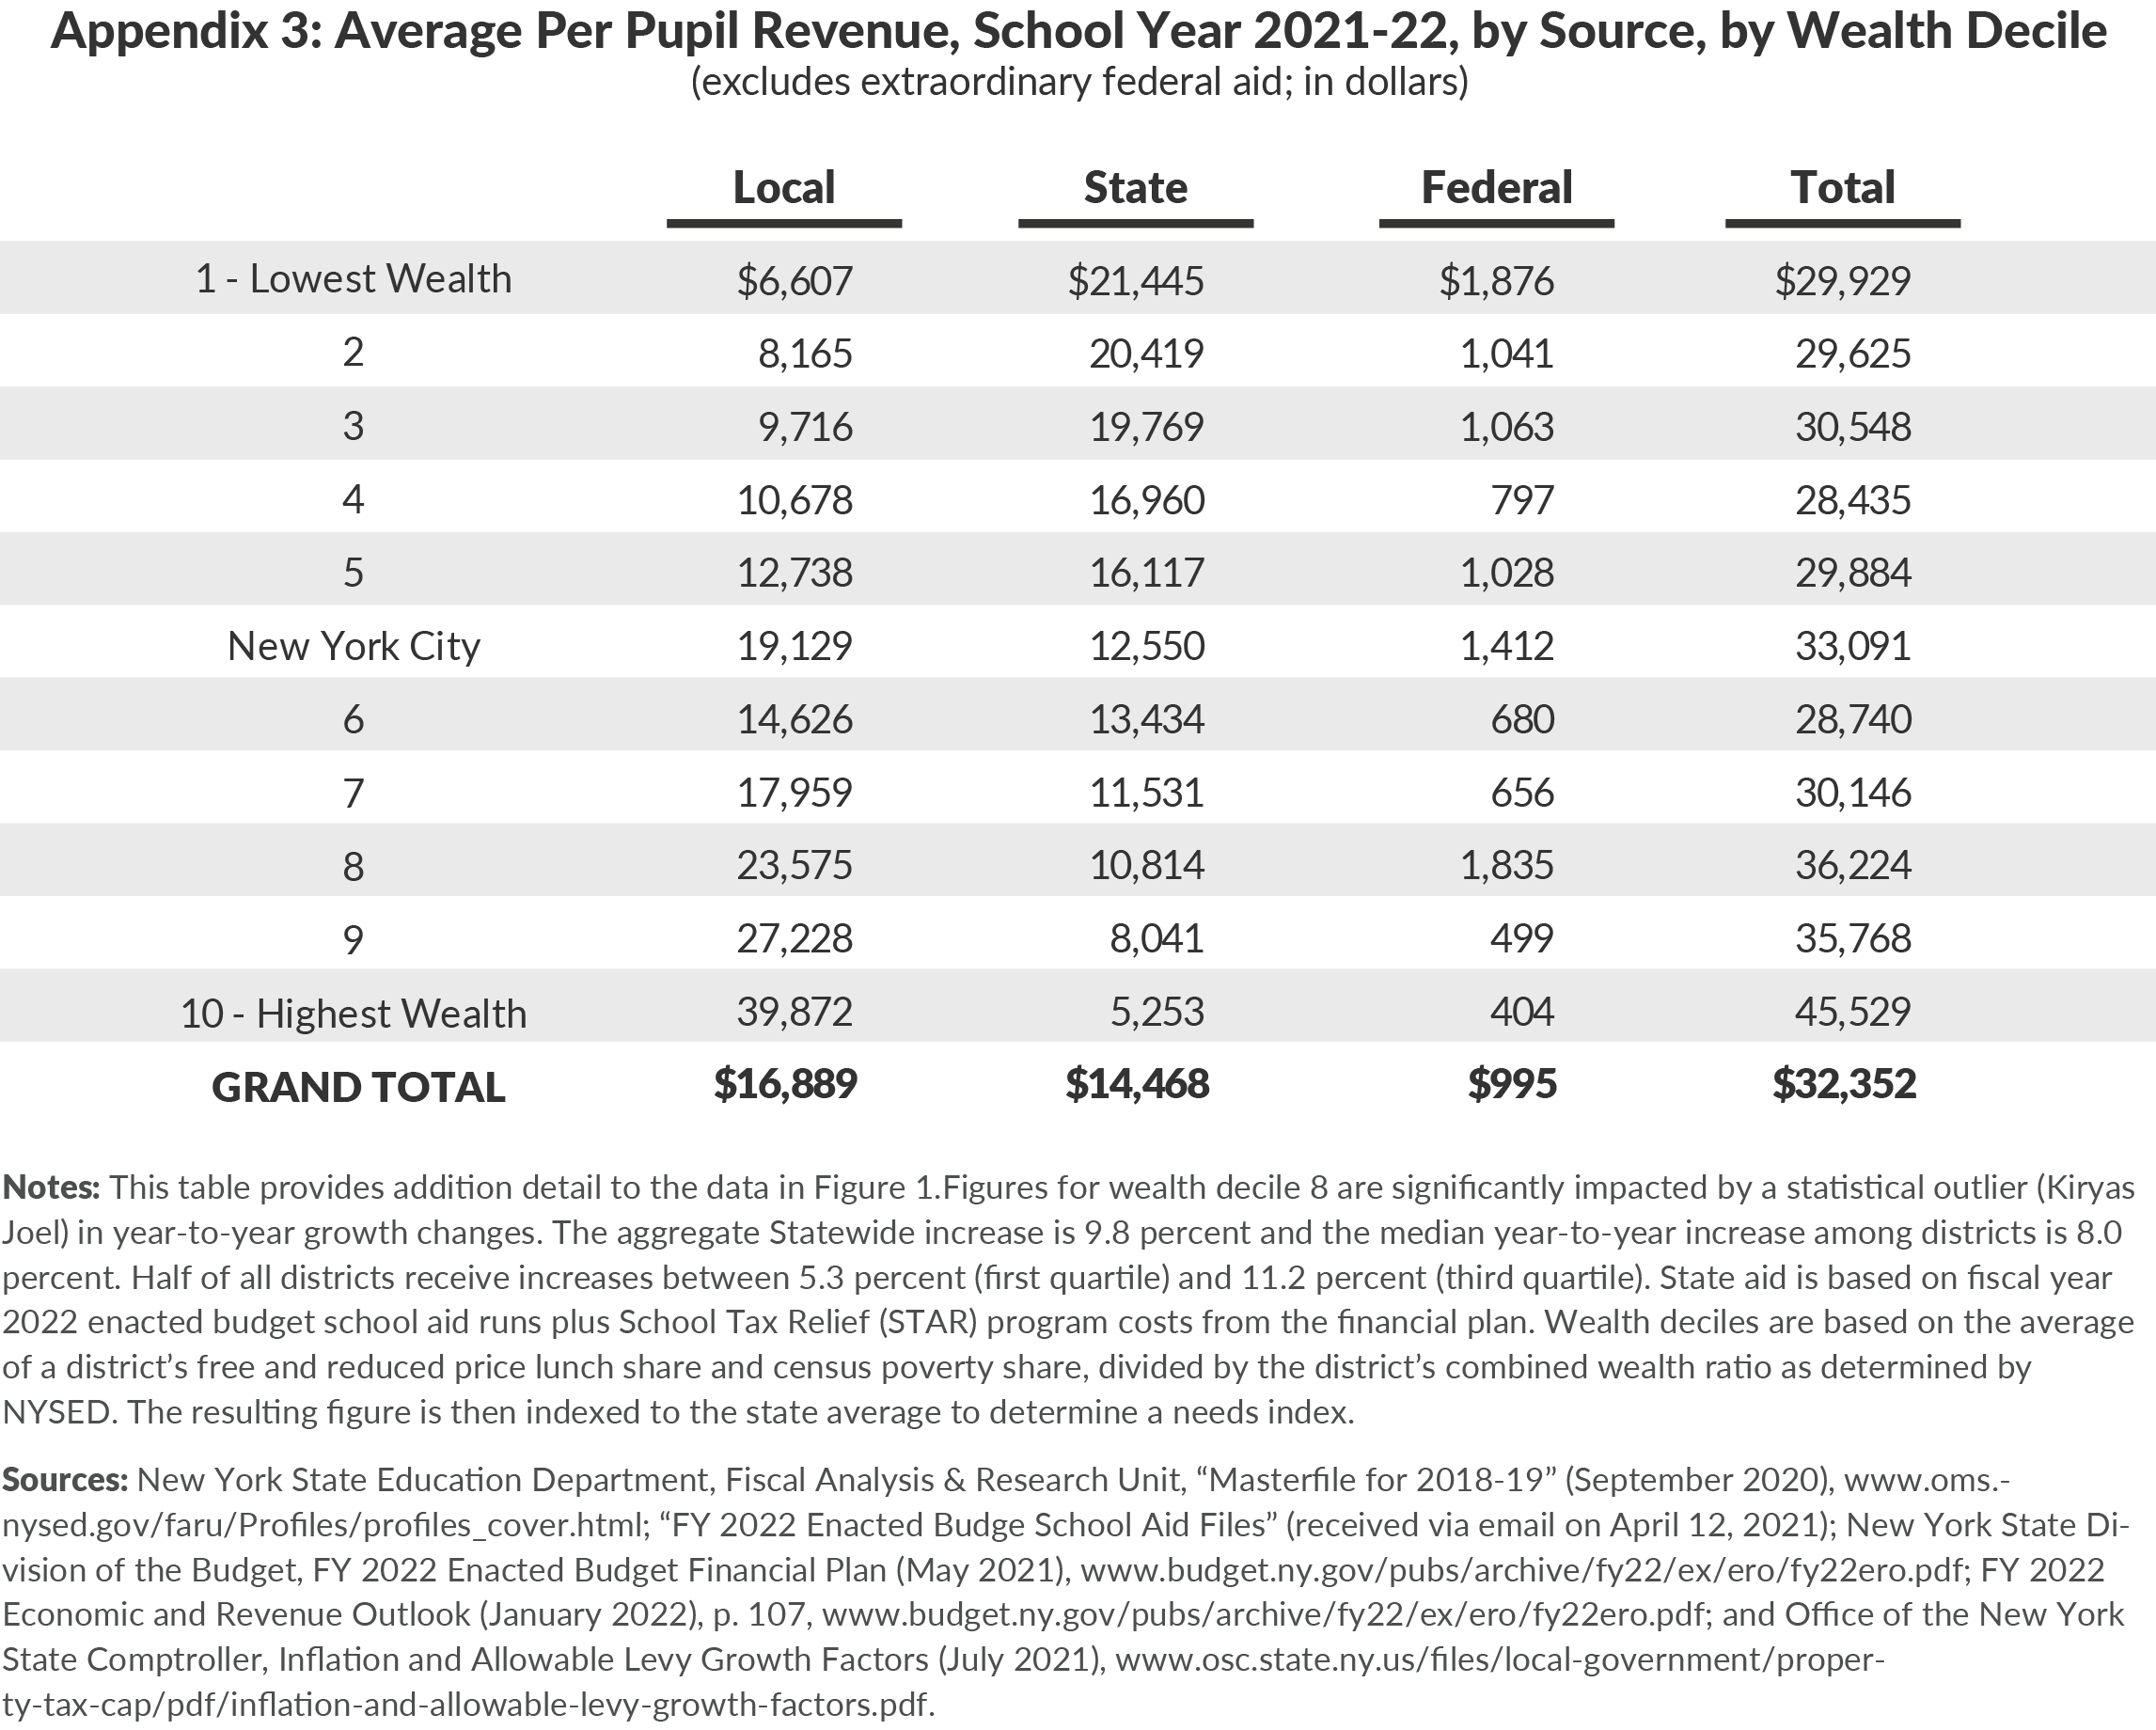
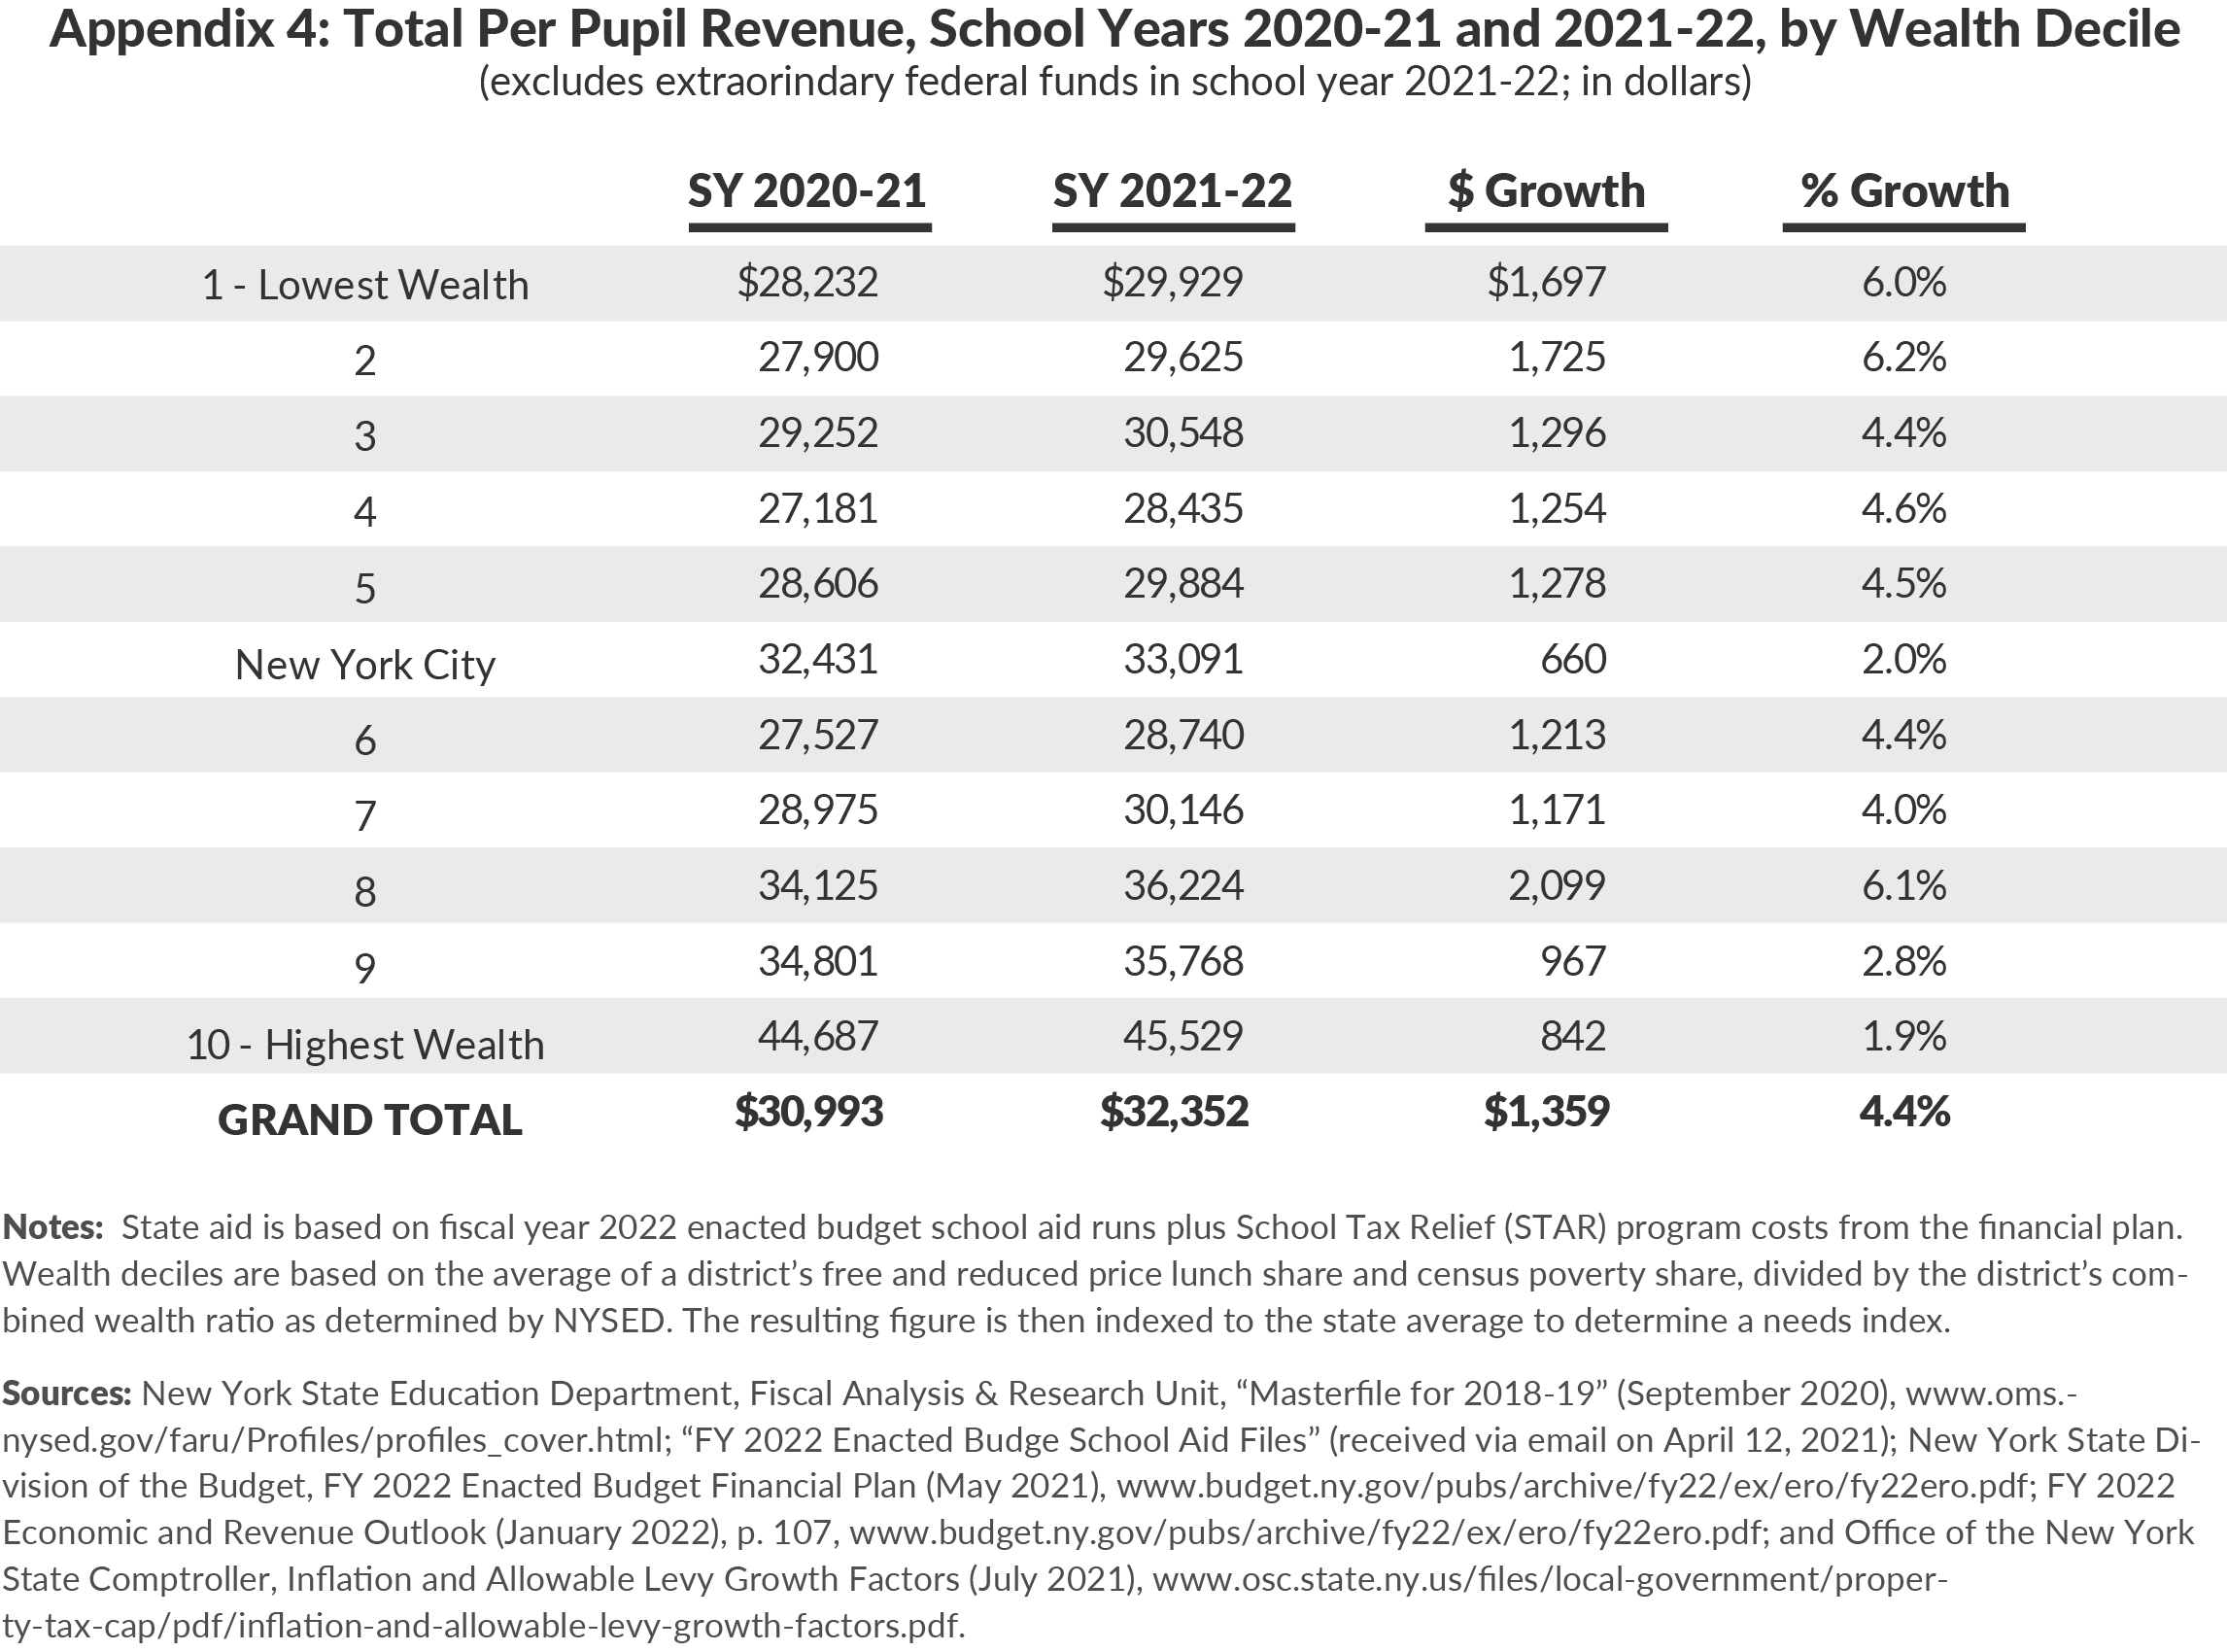
State aid increases $1,155 per pupil on a statewide basis this year. When districts are grouped into deciles based on wealth, the largest dollar increases are in the lowest wealth districts, but the year-to-year percentage increases are relatively uniform across all wealth deciles. State aid will increase an average of $1,617 per pupil in the lowest wealth decile and $358 per pupil on average in the highest wealth decile. The year-to-year percentage increase is 9.8 percent overall, with increases by decile ranging from 7.7 percent to 10.4 percent. The growth percentages are not correlated to deciles’ wealth. (See Figure 1.)
This is the result of two aid types, one that favors needy school districts and one that favors wealthy school districts. Roughly half the total growth comes from Foundation Aid, which is distributed primarily based on district wealth and needs. The other half is in expense-based aids, portions of which disproportionately support wealthier districts that have the ability to spend more on certain functions. Since wealthier districts historically provide substantial local funds to their schools, CBC previously has recommended State aid more highly target low-wealth districts to ensure resource adequacy in those districts and financial sustainability for the State.
The State Provides $2.7 billion to Districts Whose Local and Federal Funds are Sufficient to Deliver a Sound Basic Education
New York State’s constitution guarantees every student the right to a sound basic education (SBE). While a large portion of school aid is distributed primarily based on districts’ needs, including their wealth and students’ pedagogical needs, the State generally provides funds and funding increases annually to all districts, including those with significant local resources.
For school year 2021-22, 168 of the State’s 673 districts will generate sufficient revenue from local and federal aid to provide their students an SBE, as calculated using the State’s education aid formula. (These funds exclude extraordinary federal aid.) State aid for these 168 districts totals $2.7 billion. Conversely, six districts still face a combined funding gap of $35.9 million to meet their calculated SBE need.
Total Statewide Funding Exceeds the Sound Basic Education Funding Need by $13.2 Billion
The funding needed to provide every student an SBE is $64.7 billion based on the State aid formula. Excluding extraordinary CRRSA and ARP aid, State, local and federal funding for 2021-22 totals $77.9 billion, roughly $13.2 billion more than is needed for an SBE. (See Figure 2.)
The Massive Influx in Education Aid Increases the Imperative to Ensure Results and Accountability
The availability of federal funding and significant increase in State aid provides an important opportunity to address learning loss and improve educational outcomes. However, these outcomes are far from guaranteed. To increase the likelihood that students benefit from this funding, the State should identify its goals, establish expectations for results, and enhance its monitoring and accountability processes.
Even before these funds, New York State’s spending per pupil was high by national norms. In 2019, spending for education in New York State totaled $25,139 per pupil, 91 percent higher than the national average of $13,187. This divergence has increased over time. In 2008, the State’s per pupil spending was 67 percent higher than the national average ($17,173 compared to $10,259).5 For the 2021-22 school year, median total revenue per pupil (not including extraordinary federal aid) is $29,928. The lowest revenue per student is $18,986, a level of aid that is likely significantly greater than the national average. The highest wealth districts will have revenue of over $45,000 per pupil, likely triple the national average.
The State’s plans not only increase revenue to districts in the current school year, but will also accelerate the growth of school aid spending into the out-years. State aid totaling $32.5 billion this year will grow to $39.8 billion by school year 2024-25, a 21 percent increase.6 Much of the new spending in the out-years will be in Foundation Aid, which primarily is distributed based on needs.
This level of new spending in future years raises two important issues. First, while the State’s budget is projected to be balanced in the near-term, there are gaps in the out-years. Currently, the State projects a relatively modest $2 billion budget gap in fiscal year 2025. However, that year’s budget is supported by $3.6 billion in non-recurring federal aid. Thus, in the years beyond, the State is likely facing gaps of at least $5 billion.7 In light of these pressures, the State should consider significantly restraining the new funds it provides to wealthy districts.
Second, the influx of non-recurring federal money and recurring State funds is not accompanied by an adequate management, oversight and accountability process. The State should enhance its efforts to ensure aid is delivering results for students. Students, parents, teachers, and other school staff have experienced seismic disruptions in learning over the past 18 months, and many students have lost valuable progress. Furthermore, the coming months will continue to prove challenging.
State leaders should work with districts to set measurable goals to address the disruptions and improve learning outcomes going forward—a process of performance measurement and management that should be applied government-wide. This requires not only monitoring how funds are used, but also monitoring student performance, including identifying learning loss, progress toward recovery from that loss, achievement over time compared to national achievement, and reductions in education disparities. Furthermore, over time initiatives should be evaluated to identify what works so programs and learning strategies can be either replicated or terminated.
Footnotes
- Total funds allocated to secondary education in New York State through CRRSA and ARP total roughly $13 billion. Portions of that aid are for specific purposes such as administration, charter schools, and separate learning loss grants.
- CBC analysis by wealth deciles is based on CBC’s rankings of districts by wealth. Wealth deciles are based on the average of a district’s free and reduced price lunch share and census poverty share, divided by the district’s combined wealth ratio as determined by NYSED. These are not necessarily the same as those utilized internally by State agencies.
- Estimates of local and federal aids are conservative. Local revenues are estimated based on the most recent actual revenues from school year 2018-19 grown by the allowable rate of growth for local governments calculated by the State Comptroller as 1.81 percent in school year 2019-20 and 1.23 percent in school years 2020-21 and 2021-22 for districts outside of New York City. New York City’s local revenues are based on the most recent actuals and estimates based on the fiscal year 2022 adopted budget. It is possible that actual local revenues – especially those for New York City – will ultimately be higher than current estimates. Recurring federal aid is assumed to be flat.
- The fiscal year 2022 State budget includes provisions requiring that at least one-eighth of ARP funding by spent each year from school year 2021-22 through 2024-25. The budget also includes requirements for each district to develop and publish a plan on intended uses of ARP funds. See Sections 9-a and 9-b of Part A of Chapter 56 of the Laws of 2021. Reporting requirements were also established by the federal legislation that provides extraordinary funding.
- National comparisons for prior years are based on data from the U.S. Census Bureau, a different data source than the school aid data used in all other tables and figures, but are used to illustrate the relative spending rates in New York versus national averages. See U.S. Census Bureau, “Annual Survey of School System Finances Tables” (accessed September 13, 2021), www.census.gov/programs-surveys/school-finances/data/tables.html.
- Based on figures included in the FY 2022 Enacted Budget Financial Plan. See New York State Division of the Budget, FY 2022 Enacted Budget Financial Plan (May 2021), pp. 99-102, www.budget.ny.gov/pubs/archive/fy22/en/fy22en-fp.pdf.
- For more information on the State’s fiscal year 2022 enacted budget, see Citizens Budget Commission, Overview of the Fiscal Year 2022 Enacted Budget (September 1, 2021), https://cbcny.org/research/overview-fiscal-year-2022-enacted-budget.